




This article is part of a new Smarter Golf series powered by Arccos data.
You know your handicap. You know you want it lower. What you probably don’t know is what that takes, in real strokes, broken down by category.
Arccos pulled 329,000 rounds from about 21,000 golfers with USGA-verified handicaps to answer that question for us. Knowing how many strokes separate you from the golfers one level better than you right now and where those strokes are hiding is valuable information.
It’s nice to know you’re a 15 handicap and you’d like to be a 10. What’s less clear is what that jump requires. Turns out it’s not the same answer at every level and it’s not the answer most golfers assume.
The data
Arccos looked at full 18-hole rounds over the past year, counting only golfers who’d logged at least five rounds. Every figure below is a median, the typical result, not an average skewed by one blow-up round. And it’s split into the four parts of the game that make up a scorecard: tee shots, approach shots, short game and putting.
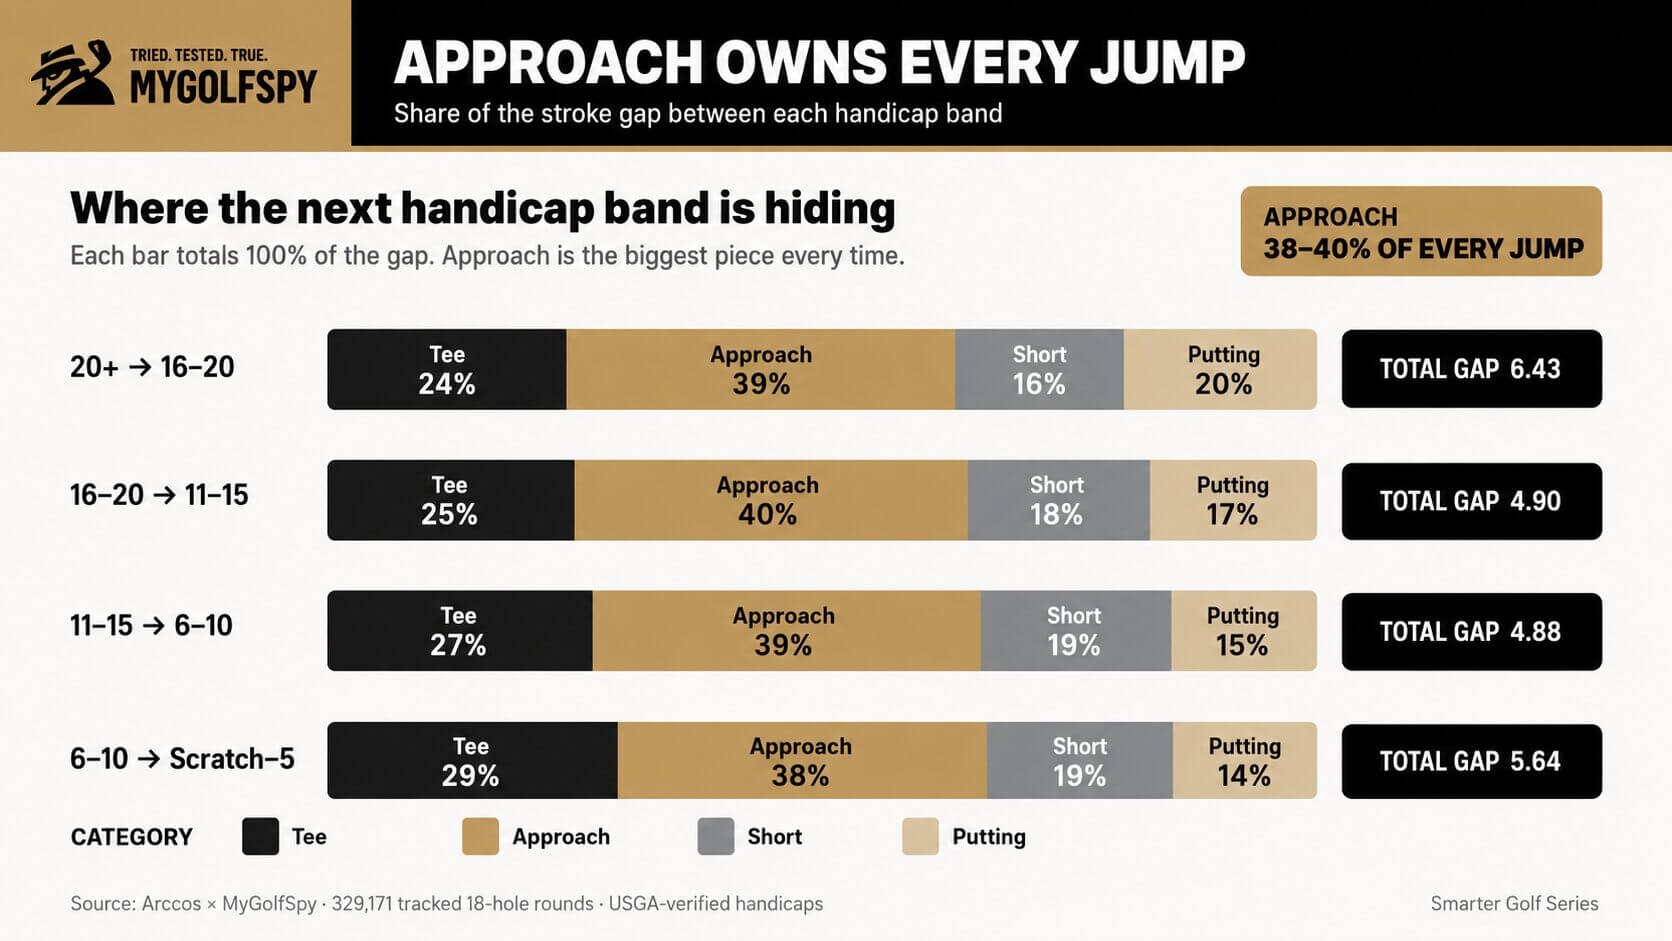
Table: The Gap to the Next Level
What the numbers are telling you
Approach play is the largest single category in every jump, sitting between 38 and 40 percent of the total gap. It doesn’t matter if you’re a 20-handicap or a single digit, the biggest chunk of ground you need to make up is the approach.
Tee shots are the second biggest factor everywhere. The thing that surprised me with this data is that tee shot importance grows as you get better. It’s 24 percent of the gap for a 20-handicap trying to break into the teens and climbs to 29 percent for a six-handicap trying to get to scratch. The better you already are, the more your tee shots matter to the next jump.
Add tee and approach together and you get roughly two-thirds of every single band jump.
Short game and putting combined make up the other third.
Putting is never the largest lever at any level. It ranges from about a fifth of the gap for a beginner down to 14 percent for a single-digit player. That doesn’t mean putting doesn’t matter. It means it’s consistently the smallest of the four pieces, at every level measured.
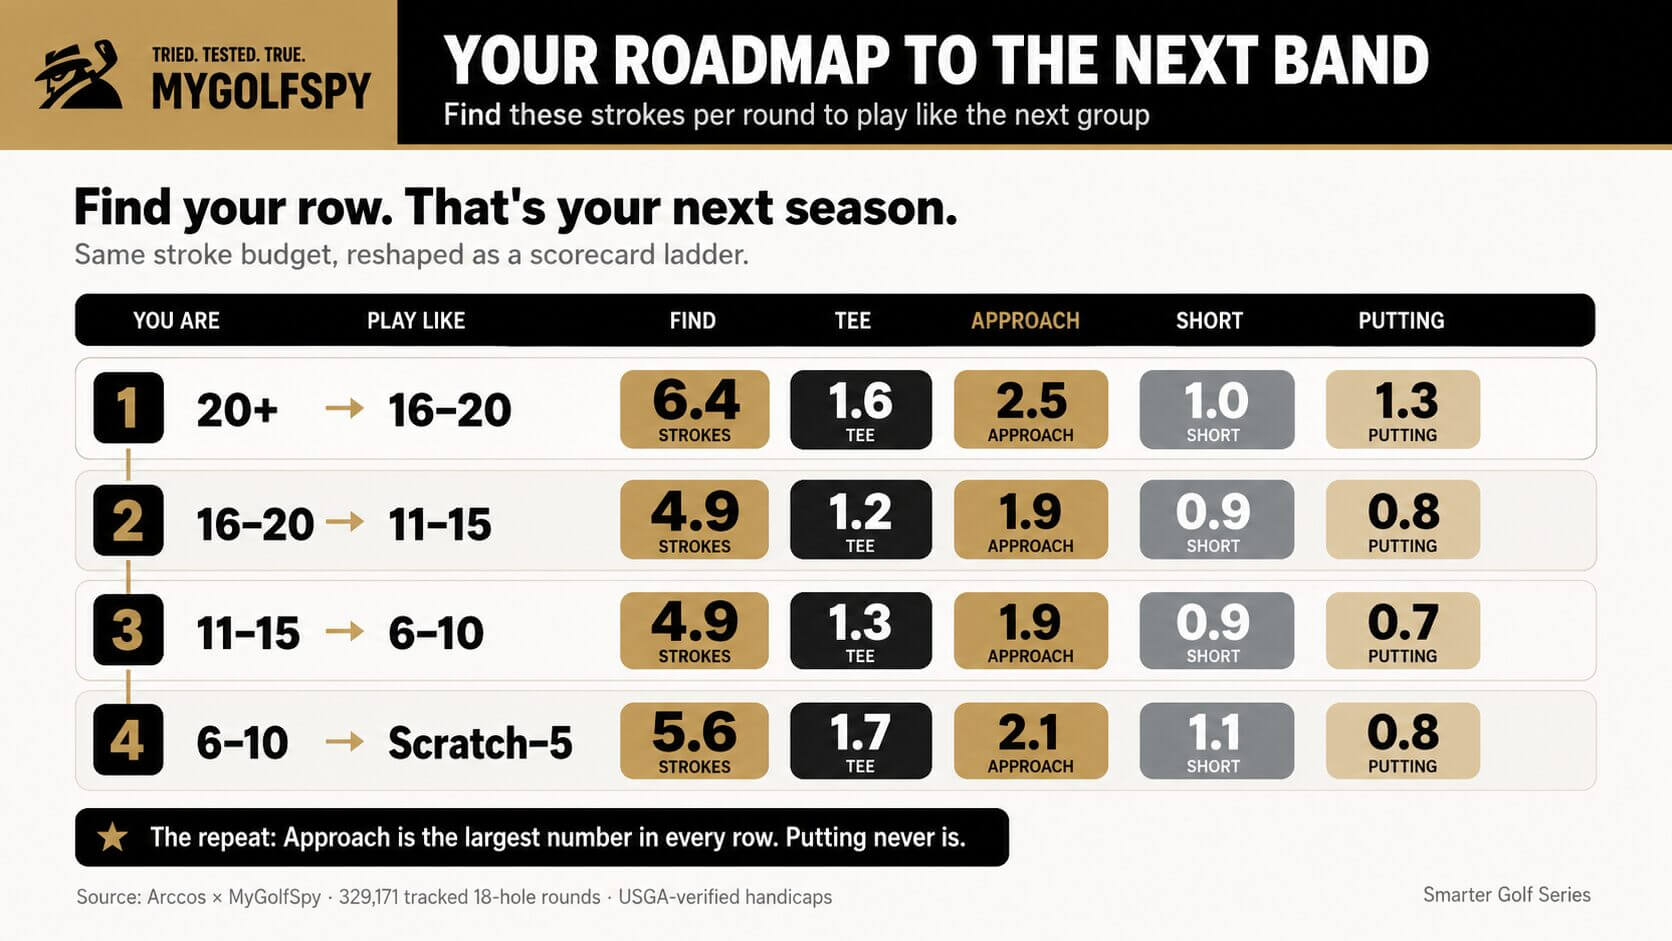
Your stroke budget
Here’s the same numbers, reshaped as a straightforward roadmap. Whatever band you’re in, this is what it takes to play like the next one up.
Final thoughts
Averages describe the typical golfer in your band. Whether you’re typical is exactly what you can’t know without tracking your own game. This chart tells you what’s costing golfers at your level in general. It can’t tell you what’s costing you specifically, on your home course, with your swing.
That’s the part only your own data can answer. Arccos Air tracks every shot of every round without needing sensors screwed into your clubs or your phone in your pocket. It finds the exact part of your game costing you strokes right now. It will then help you build a practice plan around those weaknesses. The chart helps bring some awareness but Arccos Air can make it personal.









Pete S
3 months ago
Read this twice and still not sure how to interpret the data that is being presented.
Is the take away just get better?