Support our Mission. We independently test each product we recommend. When you buy through our links, we may earn a commission.
To reiterate what we’ve said before, the golf ball is the most important piece of equipment in your golf bag.
That’s not a statement we make lightly. The golf ball is the only piece of equipment you use for every shot you hit. It’s also true that when looking at the totality of performance – speed, flight, spin – we find there’s more difference between golf balls than there is between drivers, irons or wedges.
Simply put: If performance is important to you, if you want to opt, it doesn’t matter if you shoot 68 or 98; the golf ball is critical.
Our 2026 test marks our fifth foray into large-scale ball testing. With each iteration, we’ve learned more about golf ball performance and uncovered several surprising findings (good and bad).
As you may know by now, we’ve learned “soft” is slow, performance differences are more significant than many golfers believe and a poorly made ball can fly significantly offline, even on a perfect swing.
While we made some small tweaks to this year’s test, the goal remains unchanged: We want to help you find the best golf ball for your game.
We’ve broken this article down into distinct categories to help you find the best golf ball for your game. Feel free to skip ahead or scroll on to learn more about that test, methodology and key findings.
MyGolfSpy’s 2026 golf ball test presented by UNRL took place in July at three locations in the Scottsdale, Ariz., area and involved more than 80 hours of testing time.
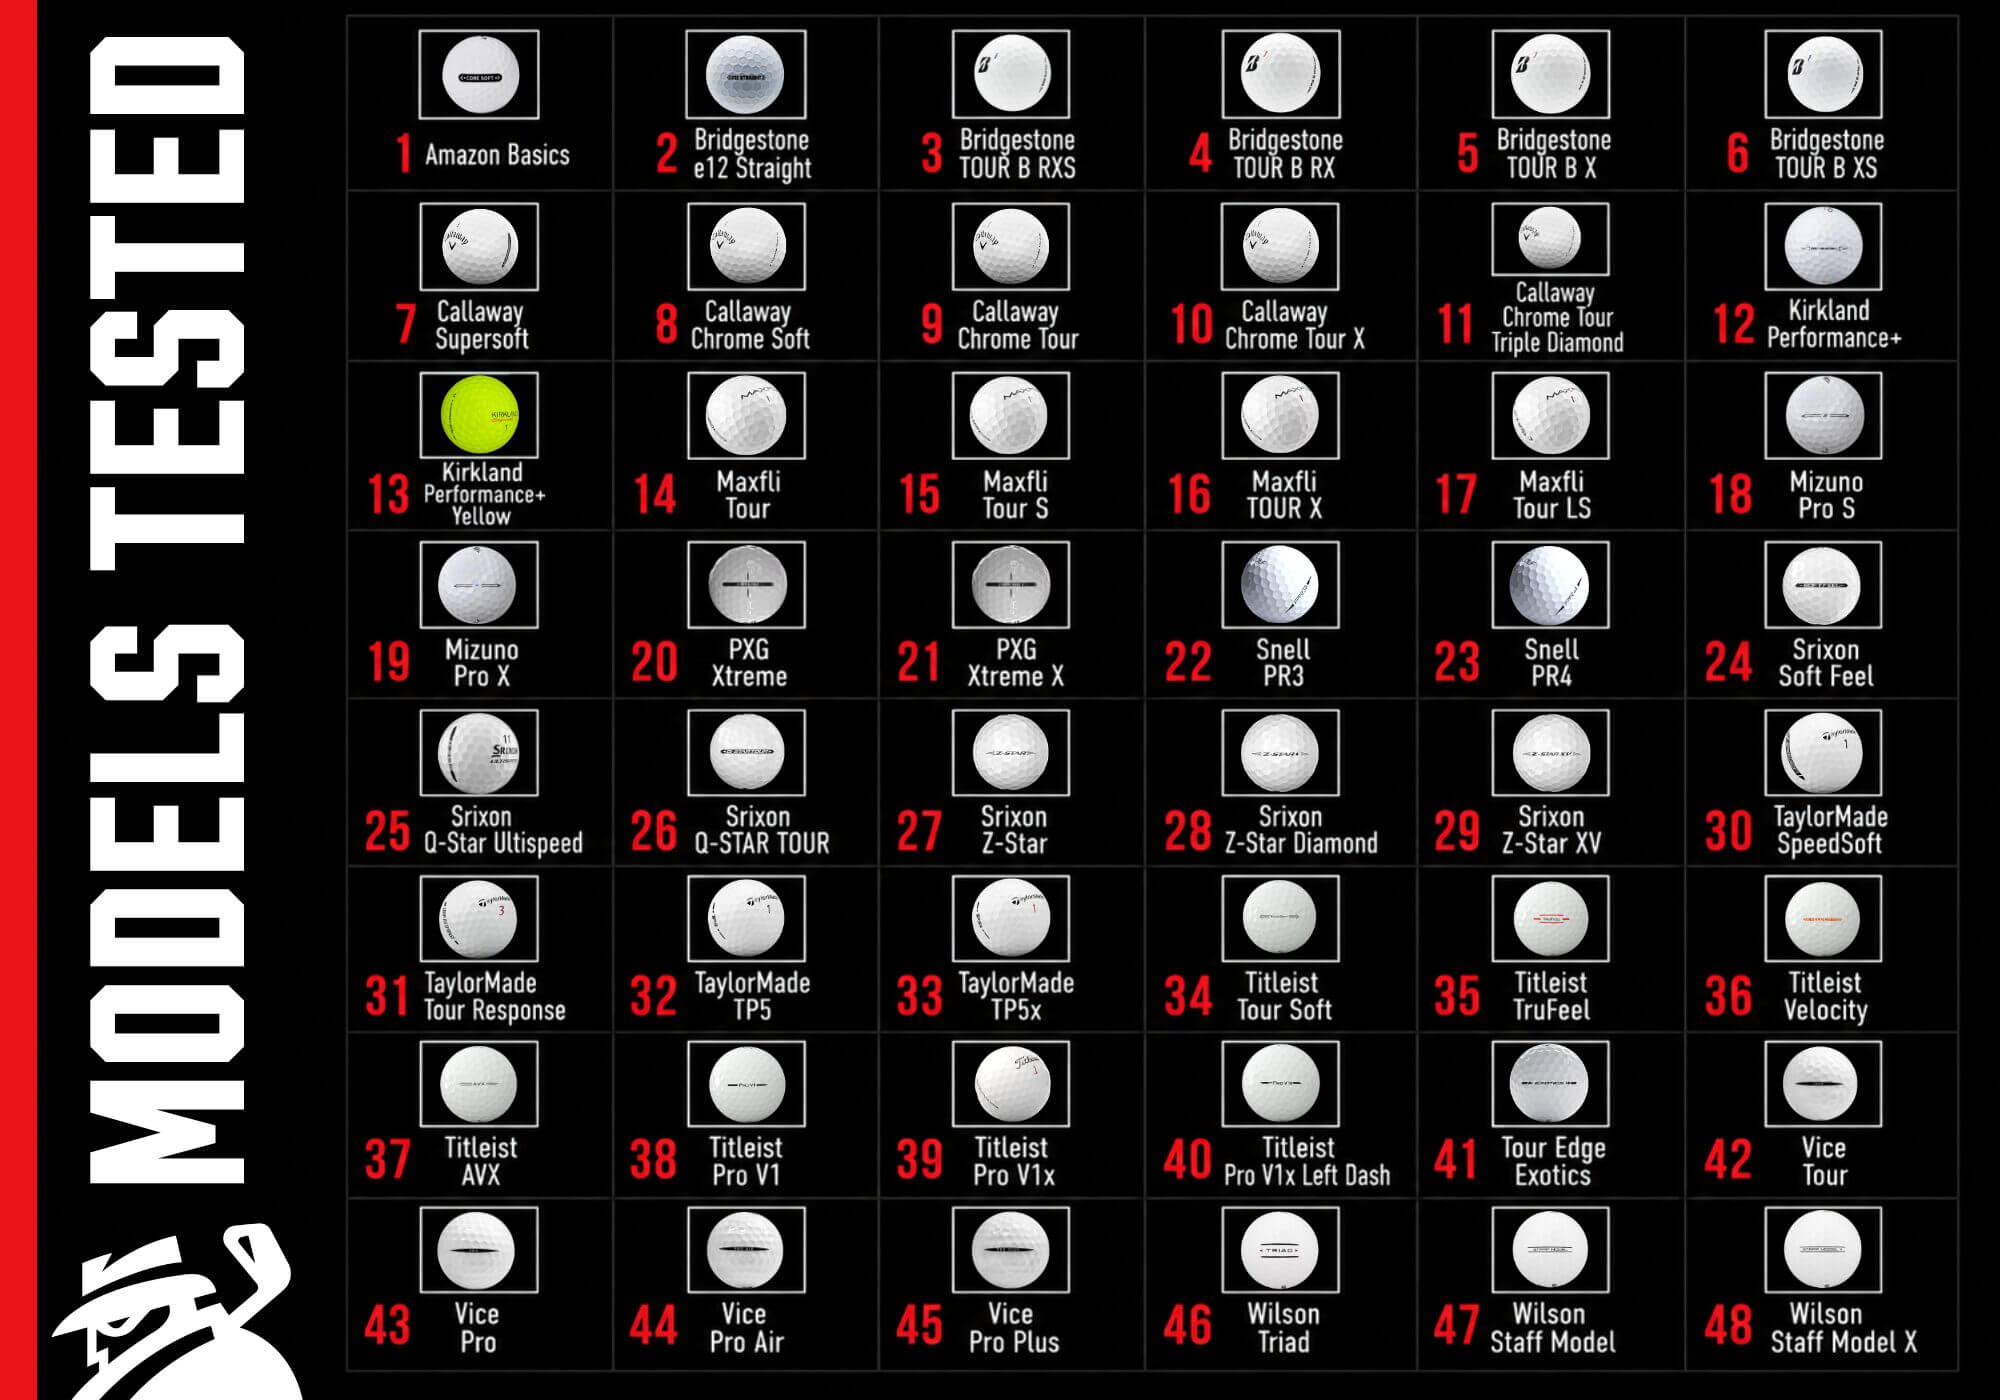
Forty-eight golf ball models were tested at three speeds with drivers and mid-irons. To better understand what the industry loosely calls “greenside performance,” we also included a 35-yard wedge test. Lastly, we tested full swings with a 100-yard shot with a 56-degree sand wedge in wet and dry conditions. A deeper dive into those results will be published separately but you can find some of that data in the tools below.
As in the past, the 2026 ball test features predominantly premium urethane offerings from major OEMs (original equipment manufacturers) and smaller direct-to-consumer (DTC) and house brands. We again included the top-selling ionomer offerings on the market.
The balls used in the test were purchased at retail and sourced from multiple vendors.
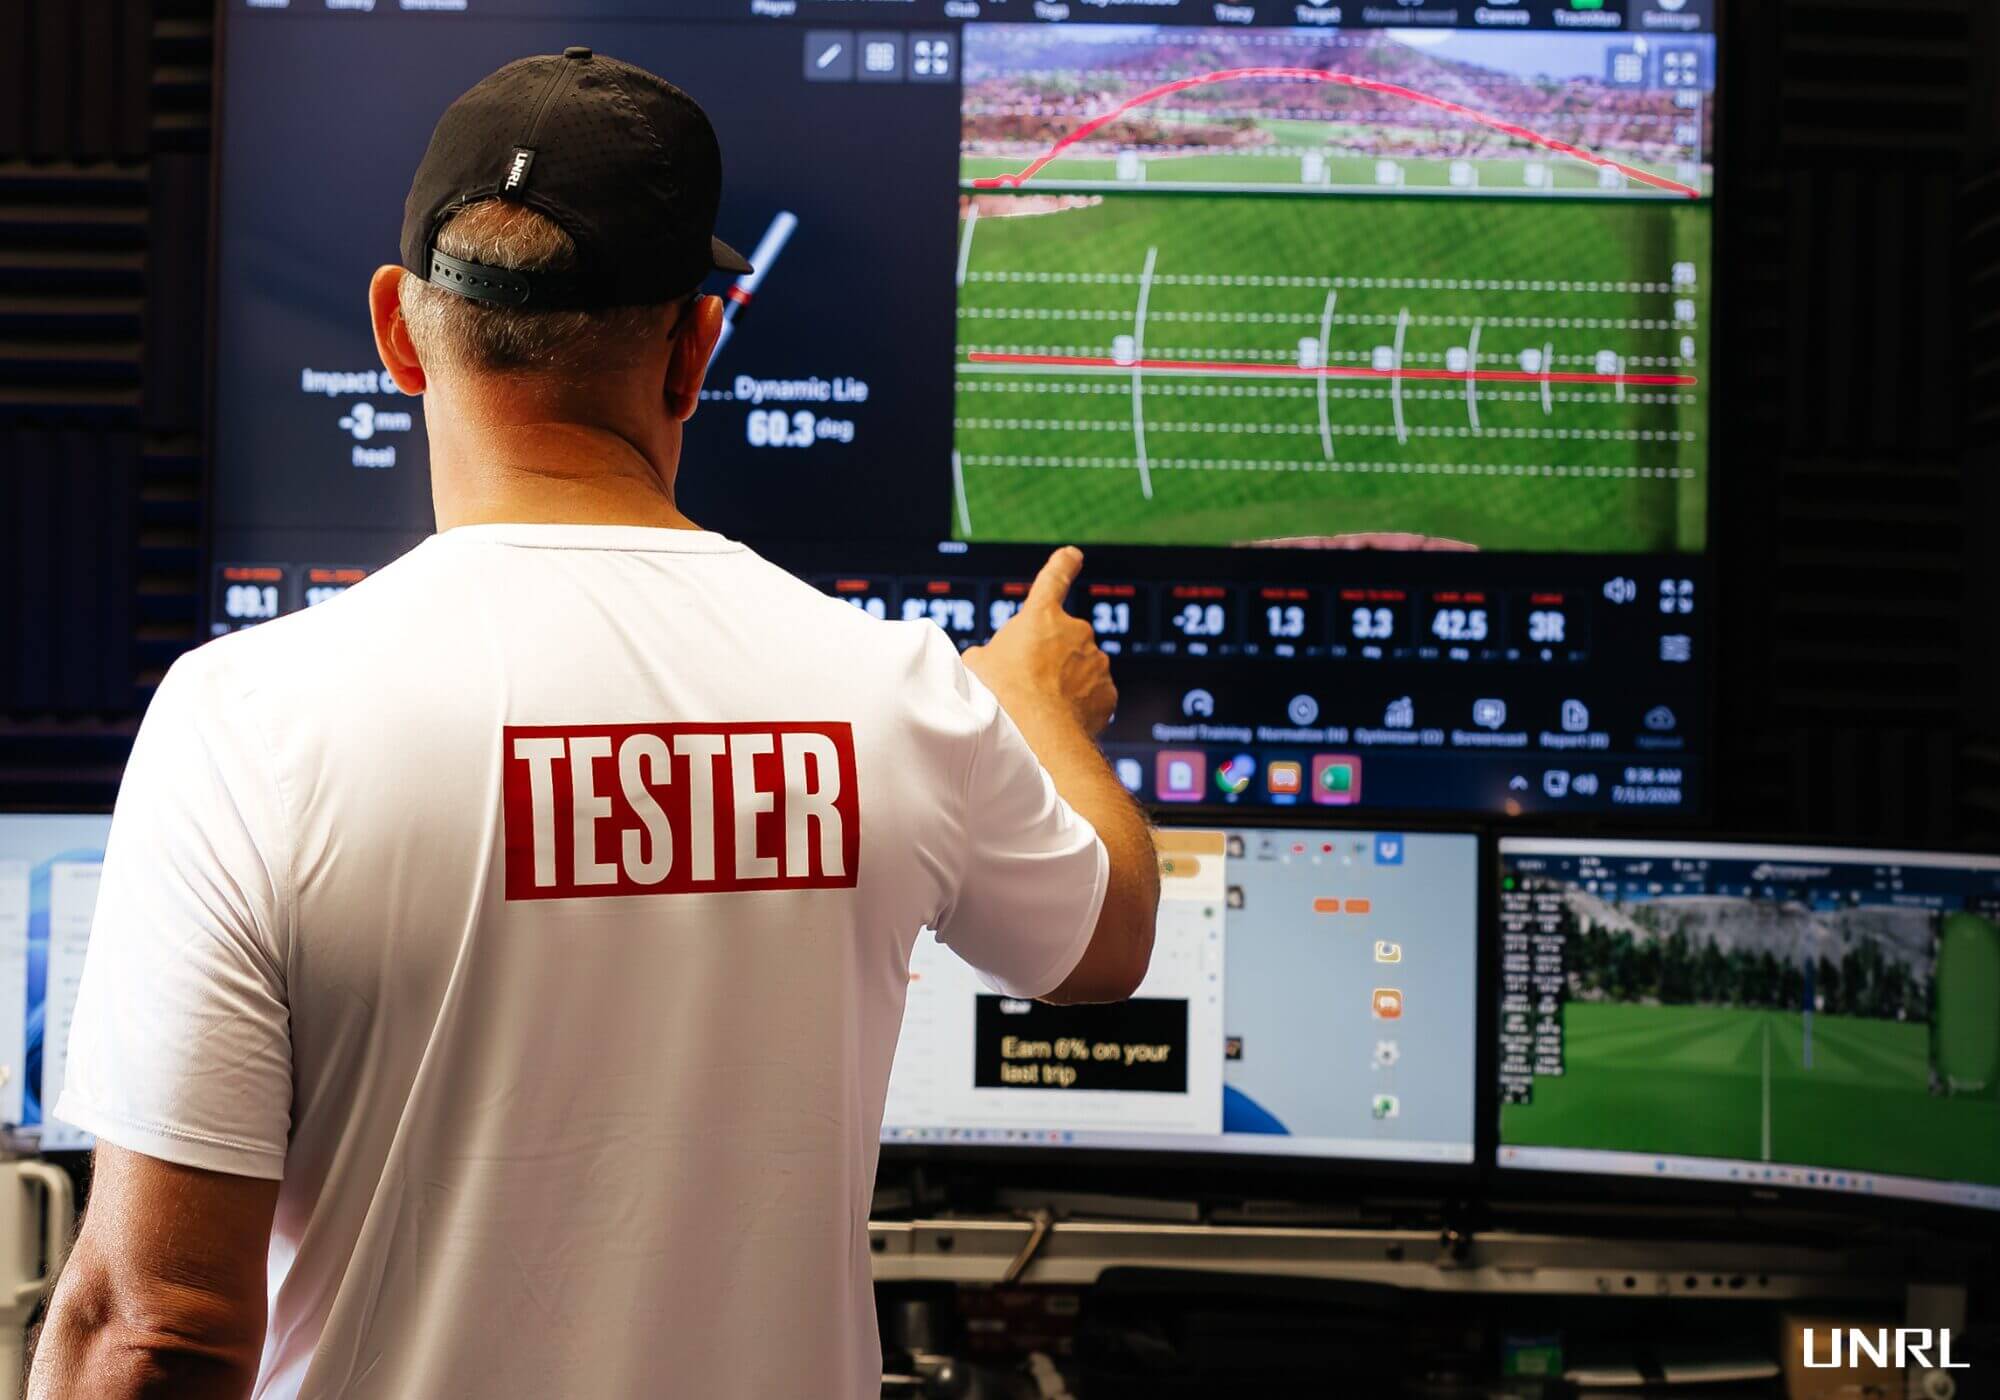
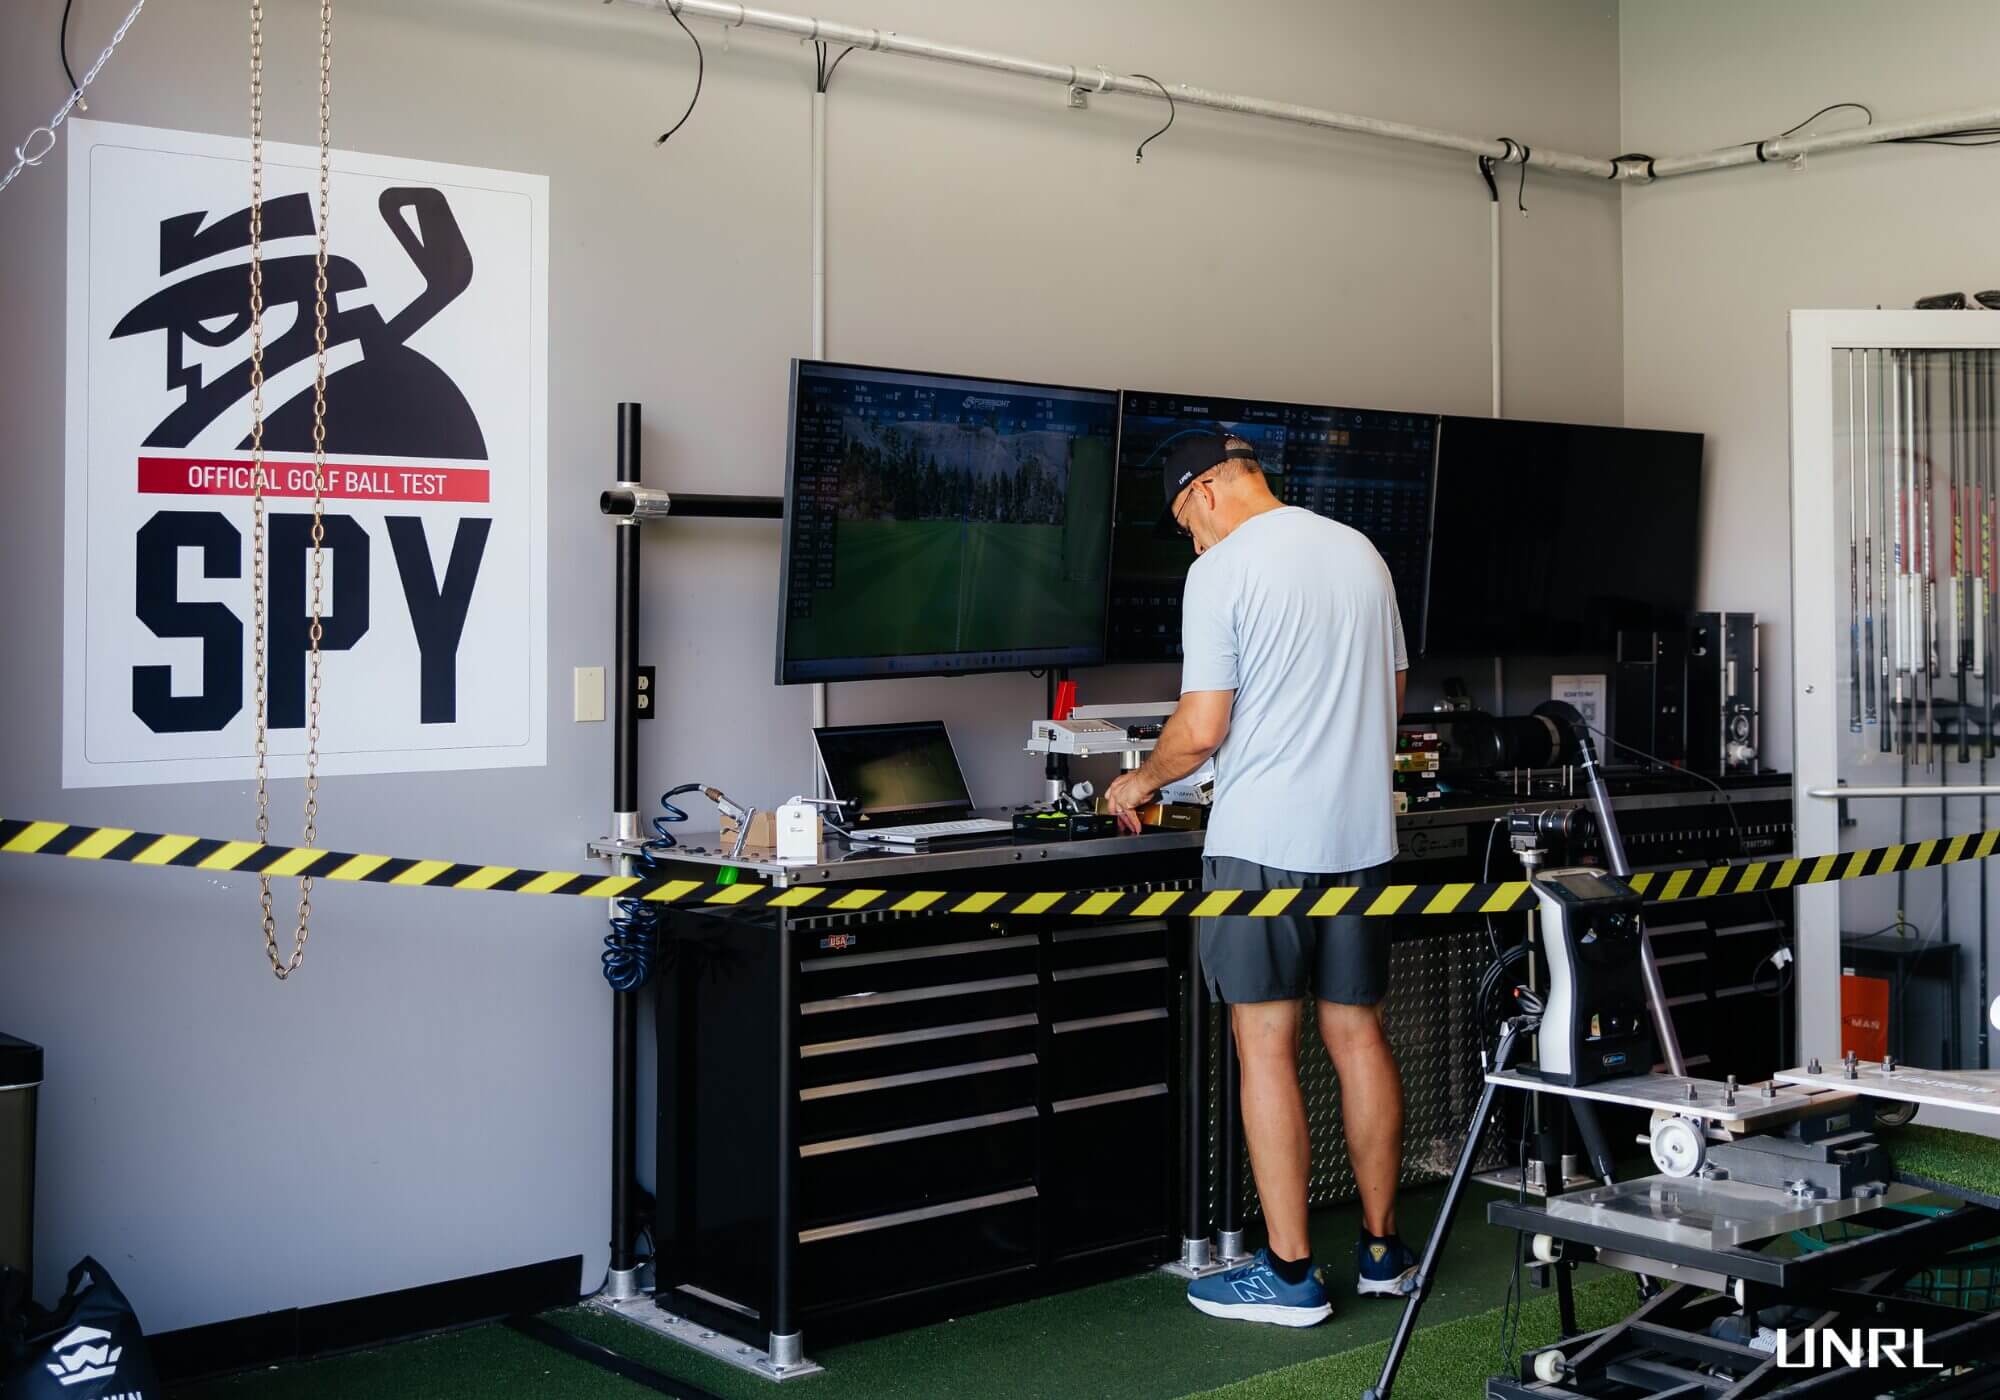
Outdoor testing was split between the CoolClub test facility at Sunridge Canyon Golf Club in Fountain Hills and Scottsdale National Golf Club. Golf Labs robots were used in both locations. Wedge testing (indoors) was conducted at CoolClubs headquarters using an ADC swing robot.
Both parties were compensated for the use of the robots and the engineers to operate them.
The median temperature during our test windows was roughly 95 degrees Fahrenheit (35 Celsius). Wind averaged below five mph and the average humidity was 41 percent. While temps were a bit cooler and humidity a bit higher than previous years, it’s still important to note the role temperature and altitude play in the results.
That said, values for key downrange variables (primarily carry and total yards) should largely be relative from one ball to the next. Metrics captured at impact such as ball speed, launch angle and spin rates will be minimally impacted by environmental factors.
Weather stations were used in both testing locations to monitor wind speed and direction.
As noted above, winds were generally calm throughout the week (wind speed +/- 5 mph) but we did encounter gusty winds early in the week which necessitated a brief pause in the test. Generally speaking, conditions were calmer than in previous years.
For each of the three speeds for the driver and iron portions of the test, the robot was calibrated to achieve specific launch and spin targets. Those targets were identical to last year although some variation is inevitable and should be expected.
Mirroring what we did last year, a 7-iron was used for the iron portion of the test.
The specific configuration for each test condition (including the clubs used) is detailed in the relevant sections below.
A calibration ball (Titleist Pro V1 Yellow) was used for each test condition to establish the baseline. This allowed us to split balls into smaller groups to help mitigate the impact of changing environmental conditions. Using a control ball also allows us to make meaningful comparisons across the entire test pool although the most reliable comparisons will be between balls within the same group.
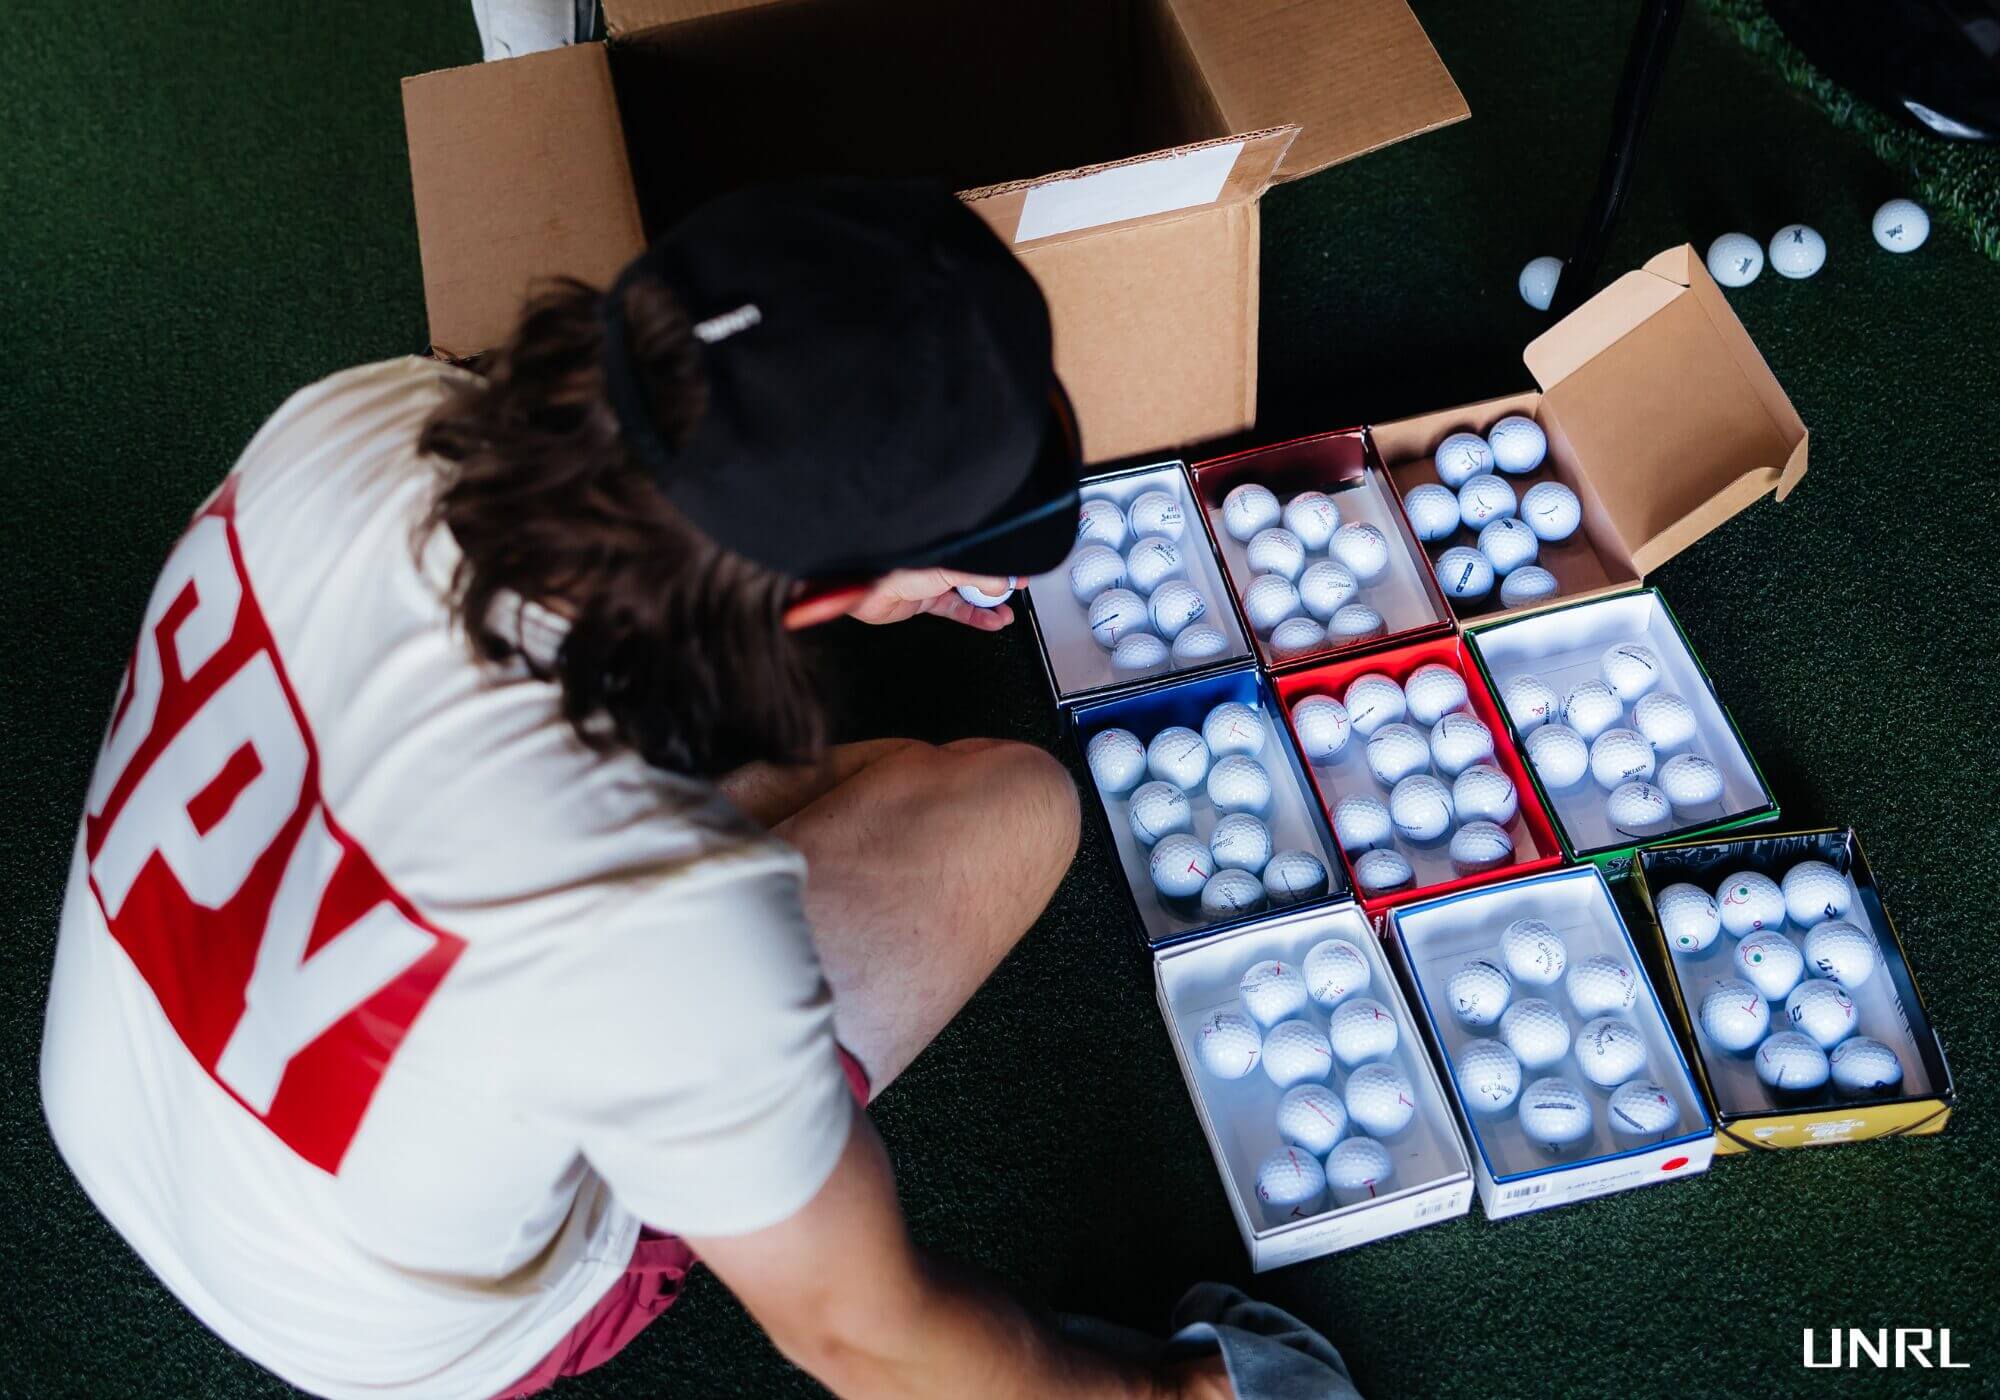
The test pool was divided into six groups containing six to 10 balls. The control ball was also hit in every group.
To the extent possible, balls were grouped by their construction and performance characteristics. Our intent is to give you the best data for a reasonable consideration set. That is to say that a golfer considering a Callaway Chrome Tour X is likely also considering the Pro V1x while a Supersoft player is probably not considering a jump to the Titleist Pro V1x Left Dash.
For each golf ball model, we hit three to four shots before moving to the next model in the group. The rotation continued several times (maintaining the same order) until all shots were hit. We then moved to the next group. The exception is the control ball which was hit in smaller bursts multiple times during the group. This allowed us to expose the control ball to a full range of environmental conditions experienced during each group’s test window. The consequence is that dispersion values for the control ball are larger than they’d be if we hit shots in a single burst.
For driver and iron testing, data was collected using Trackman launch monitors. GCQuad was run in parallel with Trackman to monitor for robot drift and changes in environmental conditions and to generally ensure the consistency of the setup throughout the test day.
With one of our goals this year being to provide meaningful dispersion data, we did not remove outliers as we have in the past. Instead, balls that produced atypical flight patterns were flagged. Those balls were later re-hit in multiple orientations. If the atypical pattern was not reproducible, the flight was considered to be wind-influenced and the shot was dropped. Individual balls for which the atypical flight was reproducible (aka “cuckoo balls”) were left in the dataset. Lastly, any shots for which there was an obvious launch monitor misread were also dropped.
The control ball was used to establish a baseline for the data presented. Values for each metric displayed in the charts and tables below are not raw launch monitor values but rather are derived from the percentage difference for each ball model relative to the control ball hit in its group.
1. Balls improve, evolve and sometimes change in inexplicable ways
It’s easy to think nothing changes between releases other than the side stamp. That’s far from a universal truth. The new TP5 is the best we’ve seen in several years and that’s especially true of how repeatably it flies — spin off the driver varied about half as much shot to shot as it did last time and it tightened up considerably through the irons and wedge. The Pro V1x Left Dash is the stranger case. It still profiles as the low-spin distance option but it no longer measures longer than our control the way it did last time and it flies a tick lower and spins a bit more than it did.
2. Quality has improved industry-wide
We mentioned the TP5 but the improvement is broader than one model. Our lab-gauge data shows the bottom of the market rising faster than the top: the worst balls we measure today are meaningfully better than the worst balls we measured five years ago and the share of balls posting genuinely poor quality scores has roughly halved. That doesn’t mean everyone is on level footing and it doesn’t mean cuckoos have disappeared; we still found them this year. It also doesn’t mean averages tell you everything. Variation shows up in ways an offline number never captures so check the distribution charts in the data for the nuance that gets lost in a mean.
3. Ionomer keeps up — until it doesn’t
We touched on this last year and it’s worth expanding. Ionomer-covered balls fall loosely into two groups: soft and not soft. The soft ones exist almost entirely to serve golfers with a stated preference for soft feel and from a performance standpoint they behave less like urethane than their firmer counterparts do. Some of the firmer ones — Titleist Tour Soft and to a lesser extent balls like Vice Tour — perform much more like urethane under most conditions. They’re fast enough to keep up off the driver and they spin enough off irons to offer real stopping power; Tour Soft was a top-10 spinner through the 7-iron at every speed we tested. Invariably, though, the deficiencies reveal themselves around the green or the moment moisture enters the impact equation. On a wet full wedge shot, the ionomer balls gave up nearly a third of their spin. The urethane balls gave up about a tenth.
4. Driver distance shouldn’t be the decider
We’re not going to tell you every ball flies the same distance off the driver. That isn’t real. But the quantifiable distance advantages diminish as speed drops and distance is seldom an absolute. The launch and spin characteristics you bring to impact significantly influence the distance equation. Your longest ball may not be mine. With that in mind, we’d suggest you find a ball that flies the way you need it to throughout the bag. Once you’ve sorted that out, maximize distance from among what’s left.
5. Money buys spin
Price and greenside spin track each other closely. Price and distance barely track at all. At our high swing speed, the expensive balls are longer. When you drop to a slower swing speed, that gap all but disappears and, at the 7-iron, price tells you almost nothing. There’s a case to be made that what you’re paying for is wedge performance which makes some sense given how many wedge shots the average golfer hits over 18 holes. For what it’s worth, Kirkland used to be an outlier here but across recent tests we’ve seen its greenside spin dip appreciably.
6. Iron distance isn’t a speed story. It’s a spin story.
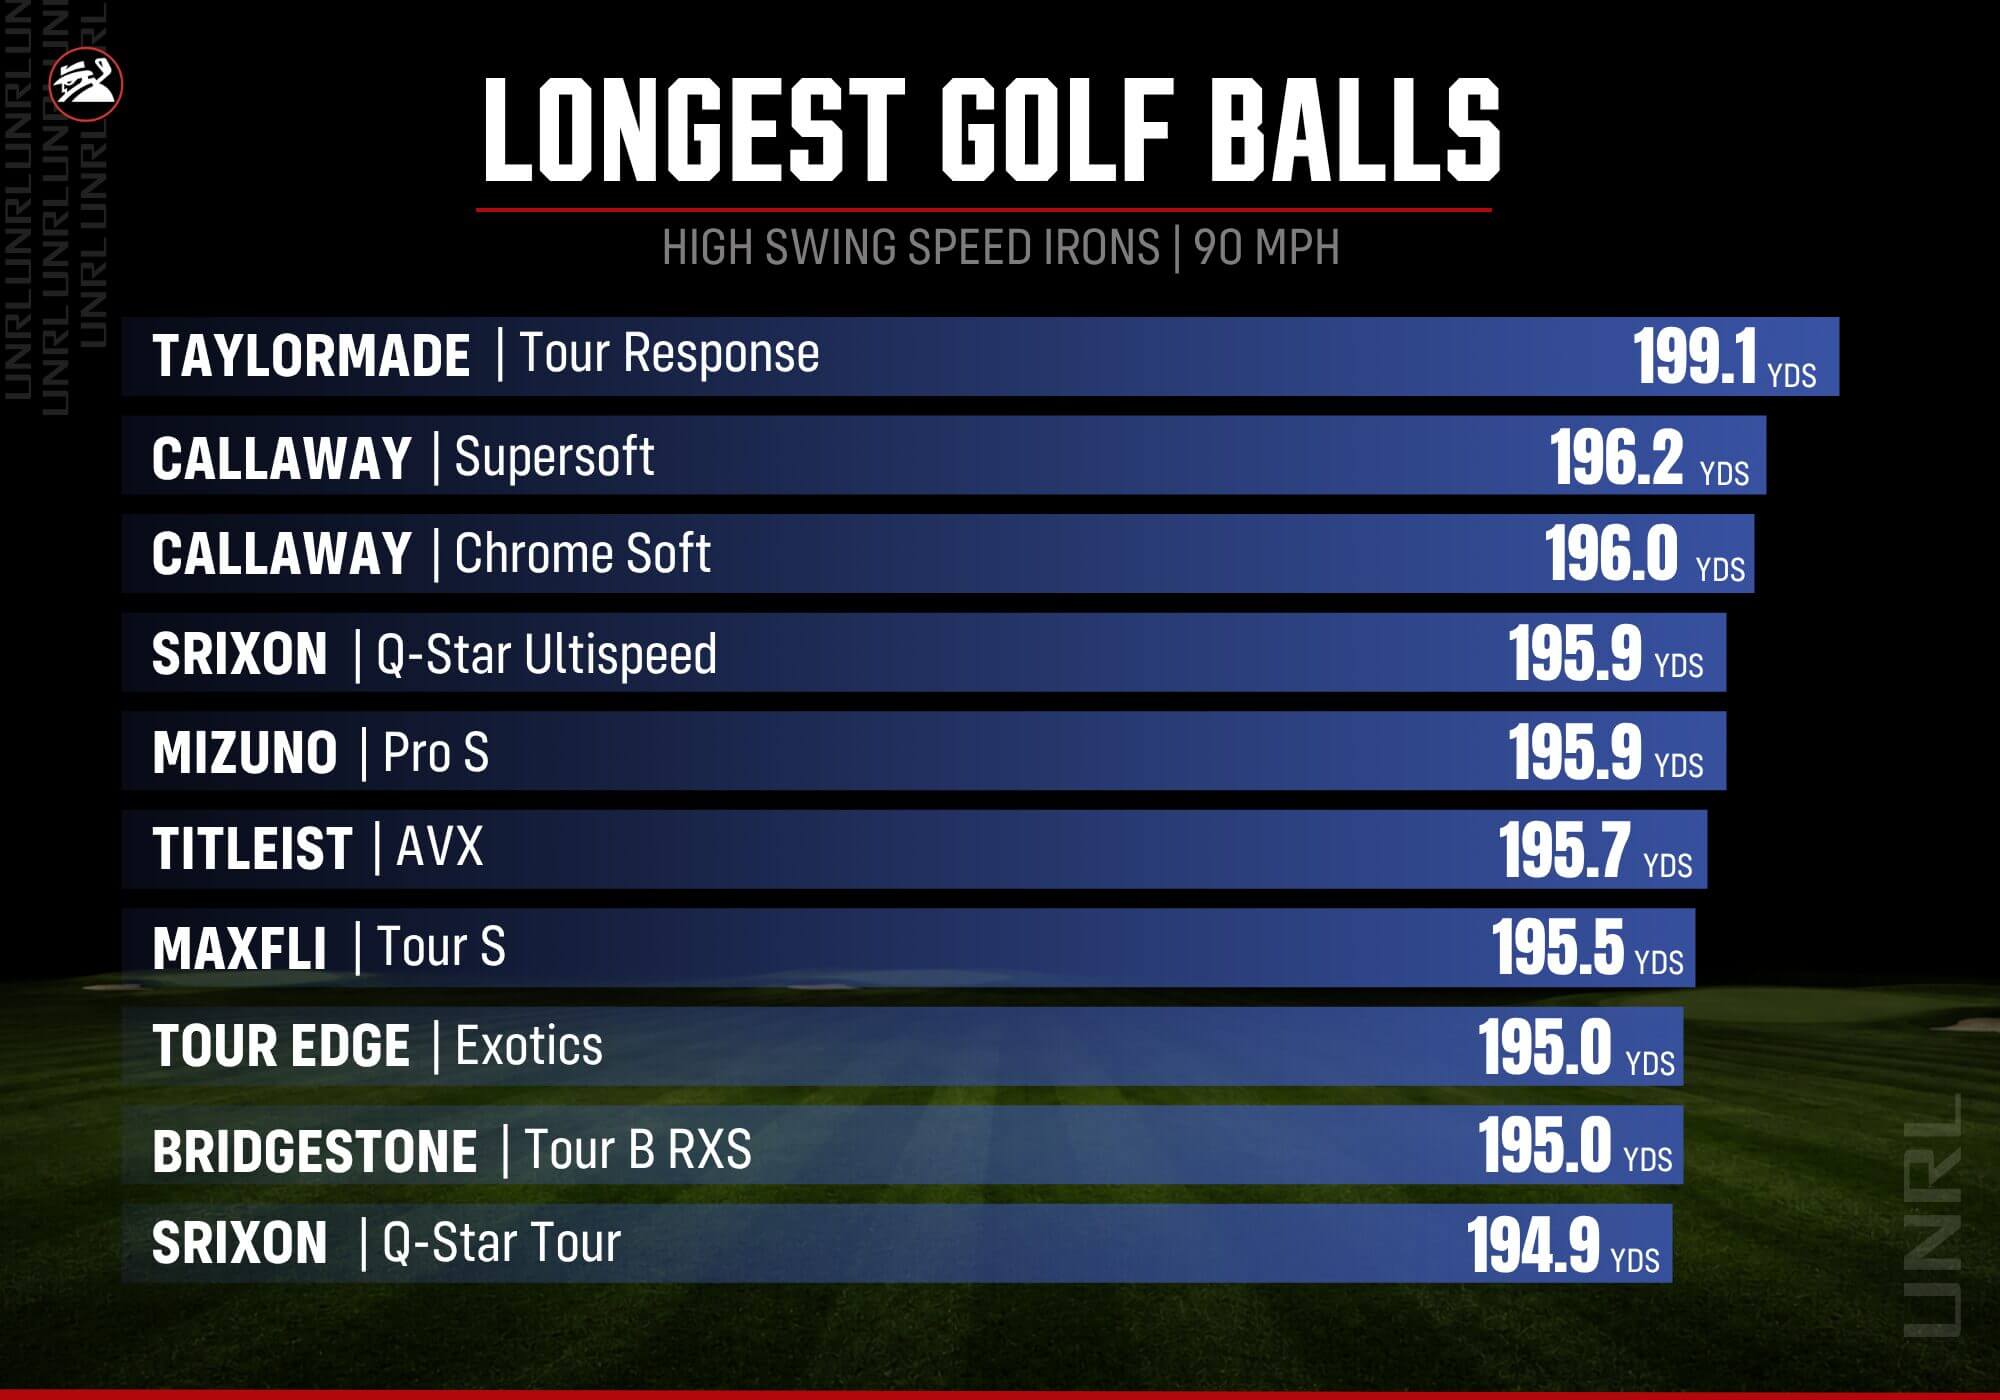
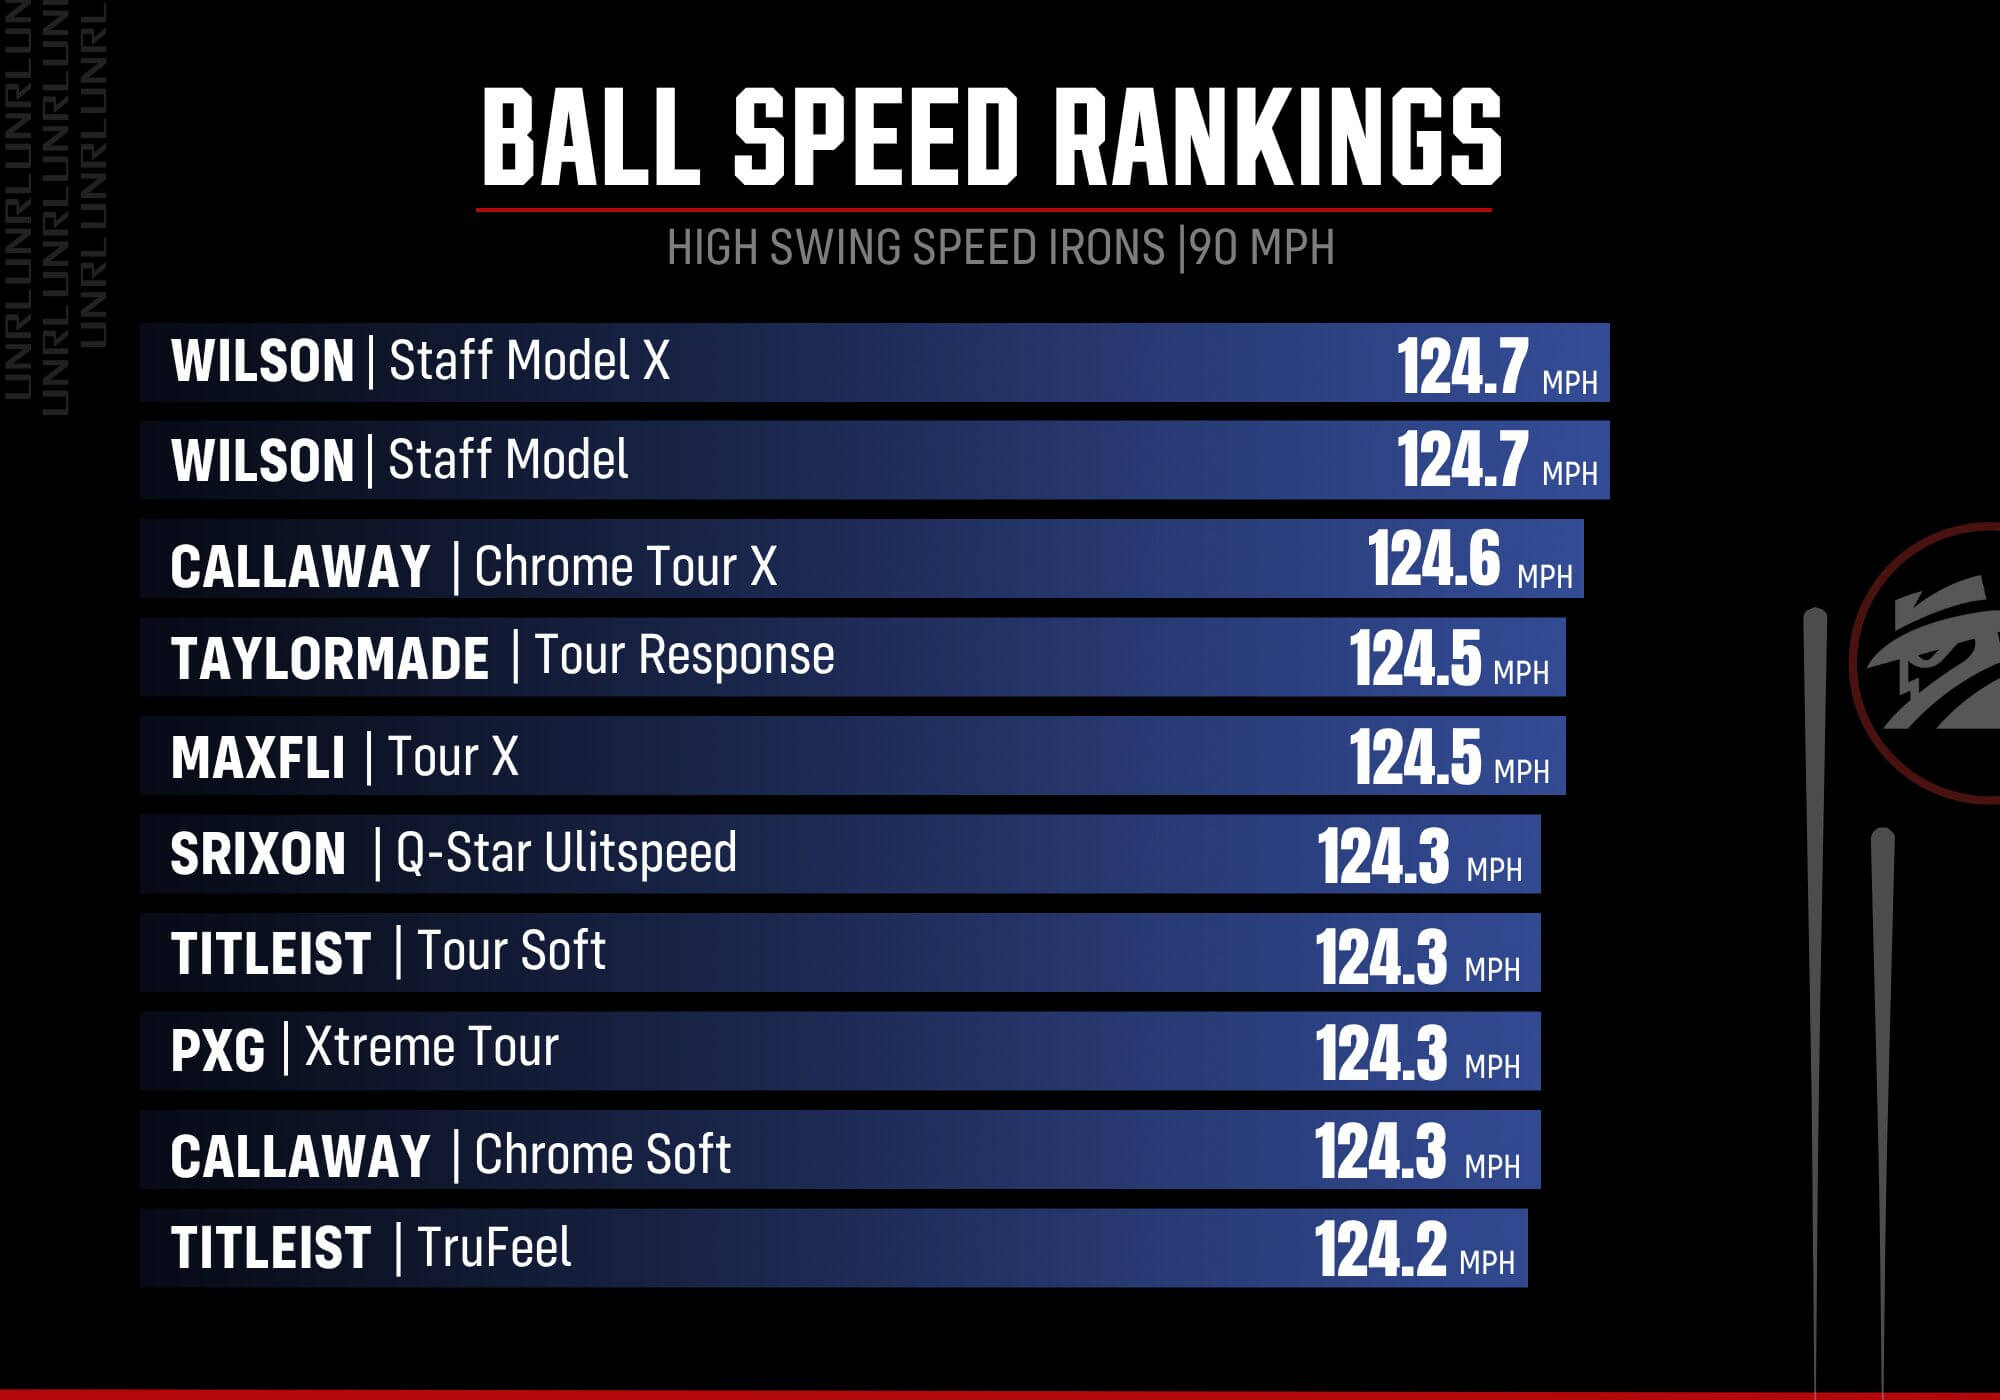
Ball speed is nearly always associated with distance and, off the driver, that math mostly works. Off a 7-iron, it collapses. From the fastest ball in our field to the slowest, the difference was about 1.5 mph. From the longest to the shortest, it was more than 10 yards. A mile and a half per hour doesn’t buy 10 yards, at least not without significant help from spin. The balls that carried farthest kept spin down; the ones that spun most handed the yardage back, no matter how fast they came off the face. The longest 7-iron we measured at high speed, Bridgestone’s Tour B RX, ranked 43rd out of 48 in ball speed.
7. Flight characteristics can change with the club
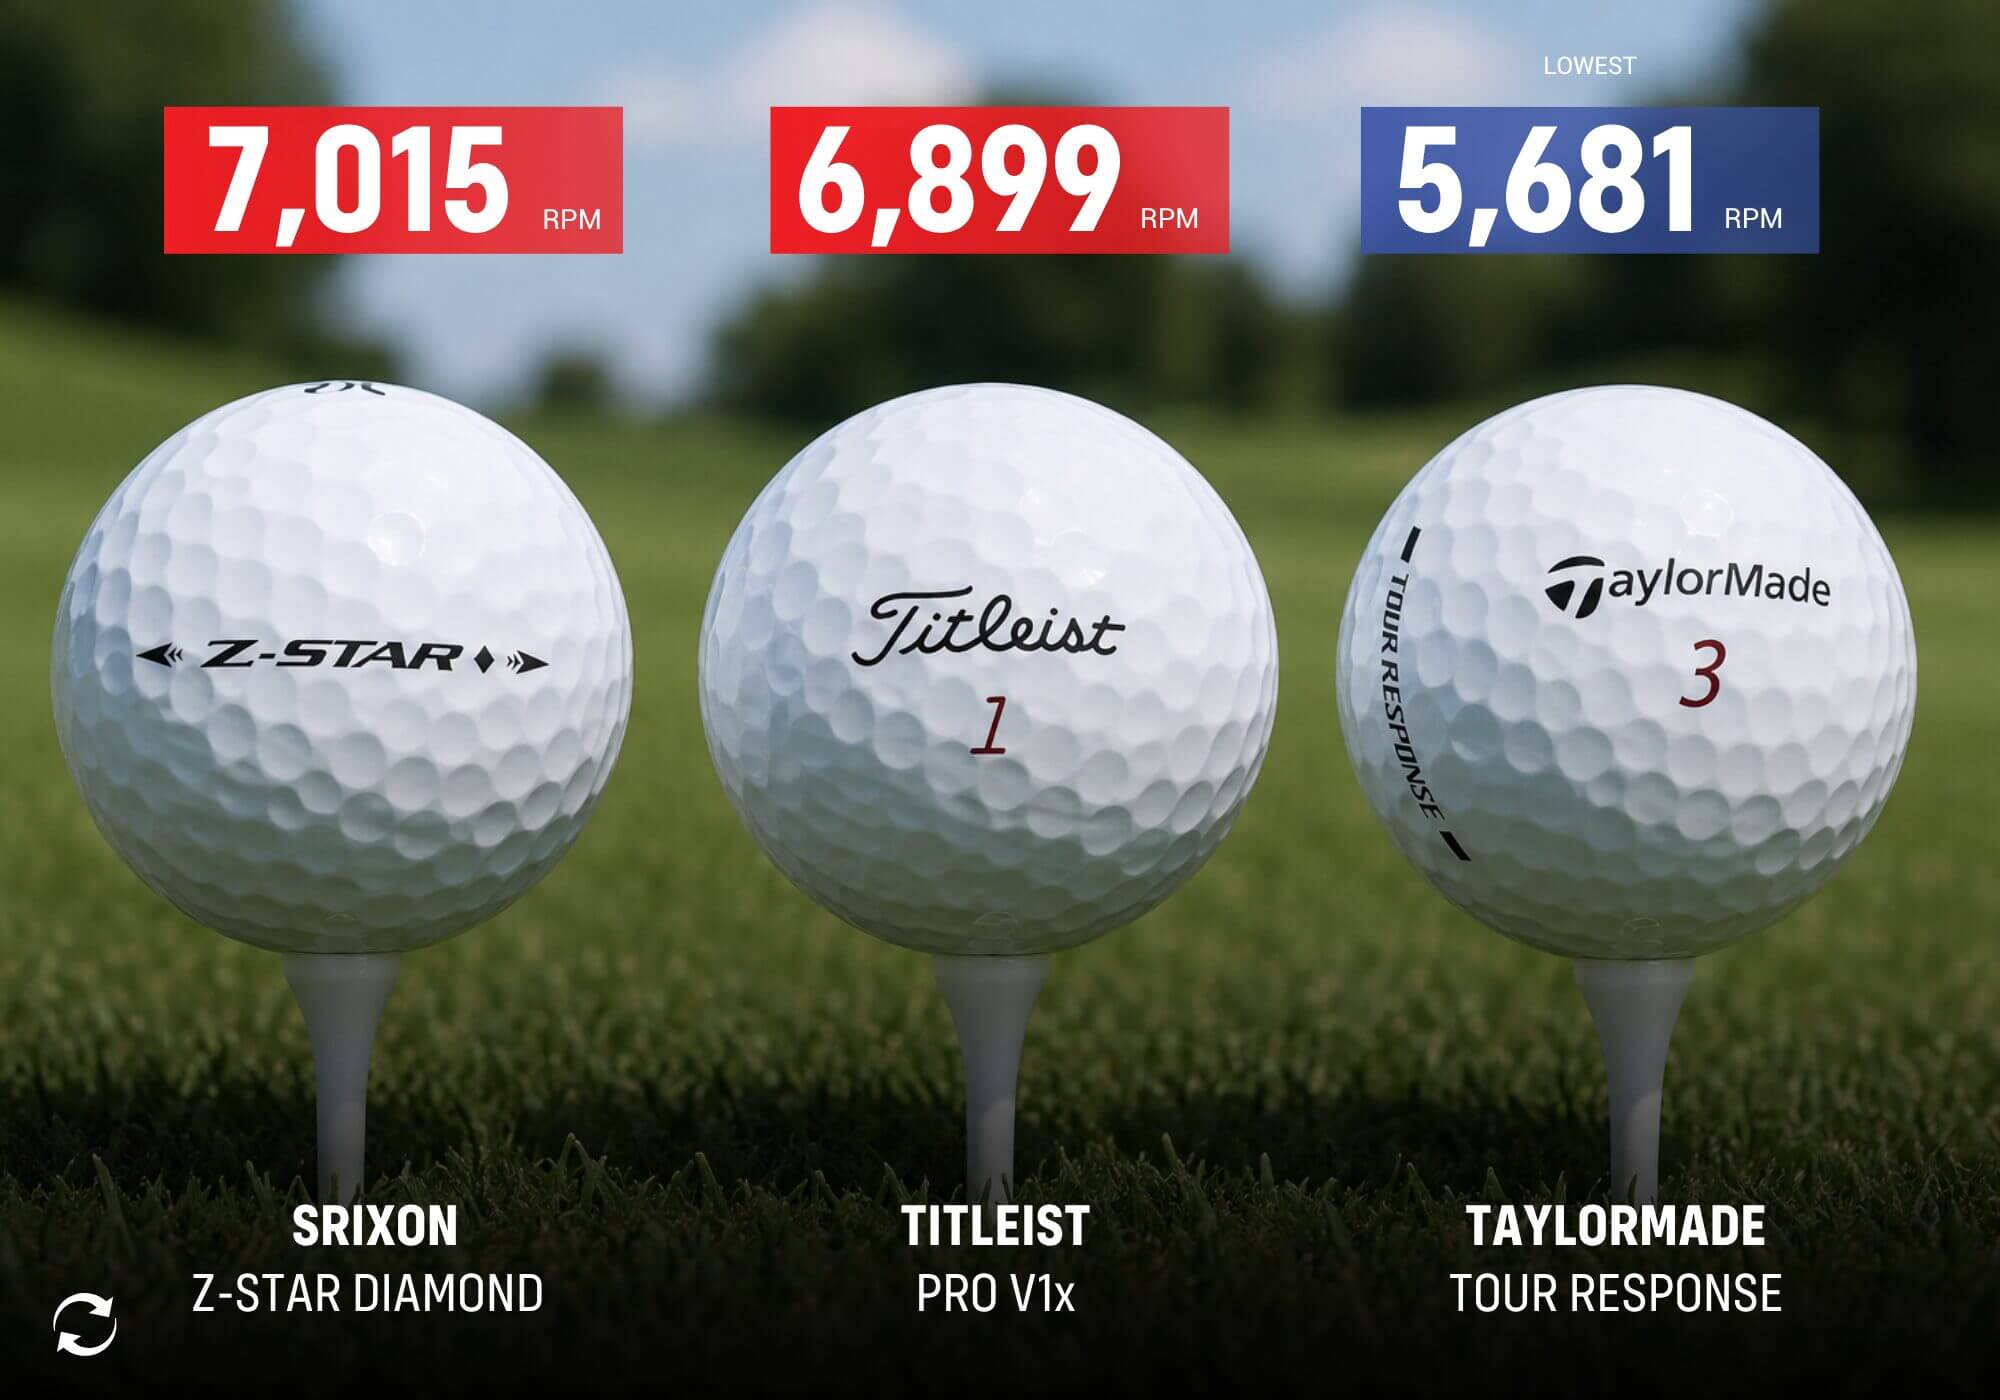
A ball’s flight isn’t necessarily consistent as you move from one club to the next. A ball that flies high off the driver may fly high off irons or it may fly through a distinctly different window. Srixon’s Z-Star Diamond is perhaps the best example: it’s among the highest-flying balls off the driver and among the lowest and most penetrating off irons — a top-10 driver flight and a bottom-three iron flight at every speed we tested. Our point in sharing this is to reiterate that what you need off the driver may not be what you need off your irons. That complicates things a bit but the good news is that there’s probably a ball that can deliver both. If nothing else, it’s a reminder that the box a ball comes in seldom tells the complete story.
This section contains a few notes to help you better understand the rest of what you’ll find in this report.
The performance section below references “soft” and “soft-ish” golf balls. As with many things in the golf equipment world, there is no universally accepted standard that defines what it means for a golf ball to be soft. You’ll find the phrase “soft feel” applied to balls that range from under 50 compression all the way to 100.
For the purposes of our discussion, we’re classifying anything with mid-70s compression or lower as soft. Balls with compression values in the low 80s may be described as soft-ish.
The softest balls on the market (below 60 compression) tend to be two-piece ionomer offerings; exceptionally soft cores are used to offset feel lost to firmer ionomer covers. The key thing to understand is that soft two-piece ionomer offerings will invariably be softer than urethane offerings marketed as “soft.”
Our target test parameters were intended to align with the launch and spin numbers produced by the average golfer in each group. As distance is the product of speed, trajectory, spin, carry and total distance, values will inevitably vary to some extent depending on the trajectory and spin produced by the individual golfer. Said plainly, based on how you deliver the club and your particular blend of launch, speed and spin, your carry and total number may differ in a meaningful way.
What that means is that while the relationship between speed, launch and spin shouldn’t change much (balls that spin the most for me will likely spin the most for you), it’s important to note that distance results reflect what happened under the specific configurations tested.
Whether it’s Trackman, Foresight or a different algorithm entirely, a “total distance” number always relies on math to normalize ground conditions. For this test, we relied on Trackman’s native algorithms. It’s worth noting that the algorithm appears to assume firm ground conditions leading to roll values that are higher than most of us will experience on the golf course. We’d recommend focusing on carry values, particularly for irons and wedges.
Finally, remember that most manufacturers describe the performance of their products relative to their other products. Simply put, a ball a manufacturer describes as offering high ball flight and low spin may actually be mid-trajectory and mid-spin relative to the market as a whole. It’s also true that as brands update models, those descriptions often don’t change so a mid-spin model from several years ago may have evolved into more of a lower-spinning option. The evolution is real, even if it’s not reflected on the back of the box.
Our descriptions of trajectory and spin are relative to the other balls in this test.
For each swing speed group, we’ve provided our top picks from the test. The balls are divided into high-spin, mid-spin and low-spin offerings. While not explicitly stated elsewhere, we’ve done what we can to include a mix of flight and compression offerings. Admittedly, it’s an imperfect science.
As some balls that are high-spinning and high-flying off the driver can be mid-flying and mid-spinning off irons (or nearly any other permutation), balls may not fit neatly into one bucket.
The larger point is that we’ve done our best to provide a selection of performance options in each category.
We should also note that any models that produced severe cuckoo balls (shots that flew too far offline to be reasonably explained by environmental conditions or where trajectory was visibly different from the larger sample) were excluded from consideration. Likewise, we also excluded balls with overly large dispersion patterns.
As usual, we have included a “Great Buy” value option as well as our top ionomer pick for each category. While the nature of those categories often means being a bit lax on our rules, we have chosen not to recommend models that produced above-average dispersion patterns.
A reminder from years past: we’ve limited our lists to our top three picks but, in many cases, we could comfortably add a few more.
To arrive at our picks, we considered key performance metrics like ball speed, trajectory, spin rate and distance. The high-speed recommendations below are based on a combination of driver and iron performance.
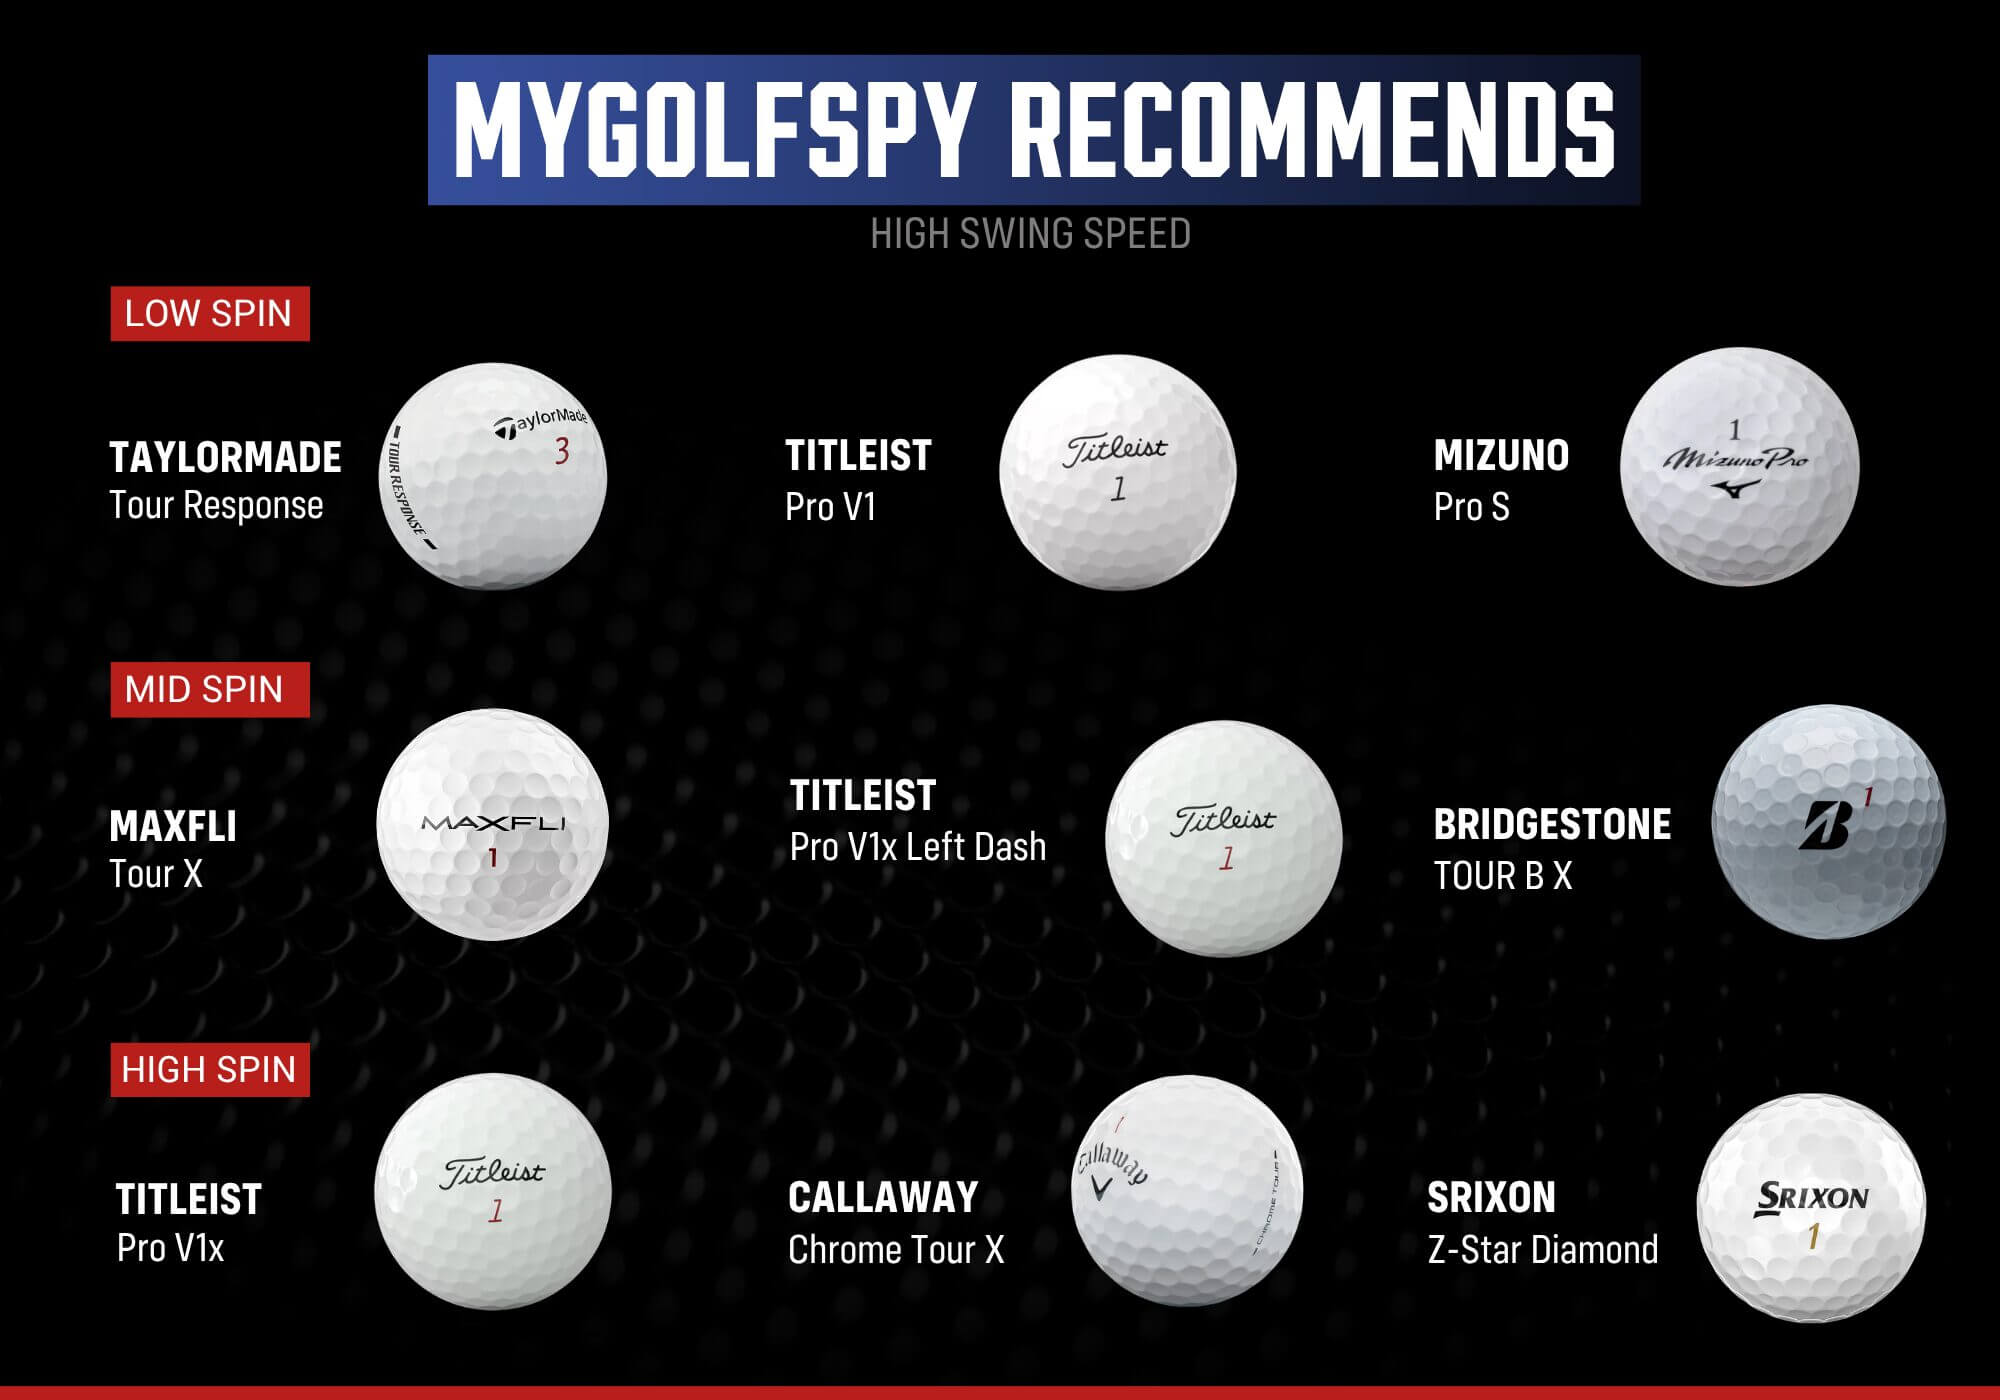
Low Spin – TaylorMade Tour Response, Titleist Pro V1, Mizuno Pro S
Mid Spin – Maxfli Tour X, Titleist Pro V1x Left Dash, Bridgestone TOUR B X
High Spin – Titleist Pro V1x, Callaway Chrome Tour X, Srixon Z-STAR DIAMOND
Great Buy – Maxfli Tour
Ionomer – Titleist Tour Soft
| Test Parameter | Test Median (All Balls) |
|---|---|
| Driver Used: PXG Black Ops Tour-1 | Ball Speed: 168.7 |
| Swing Speed: 116 | Total Distance: 318.2 |
| Calibration Launch Target: 10.5 | Launch Angle: 10.1 |
| Calibration Spin Target: 2500 | Spin: 2311 |
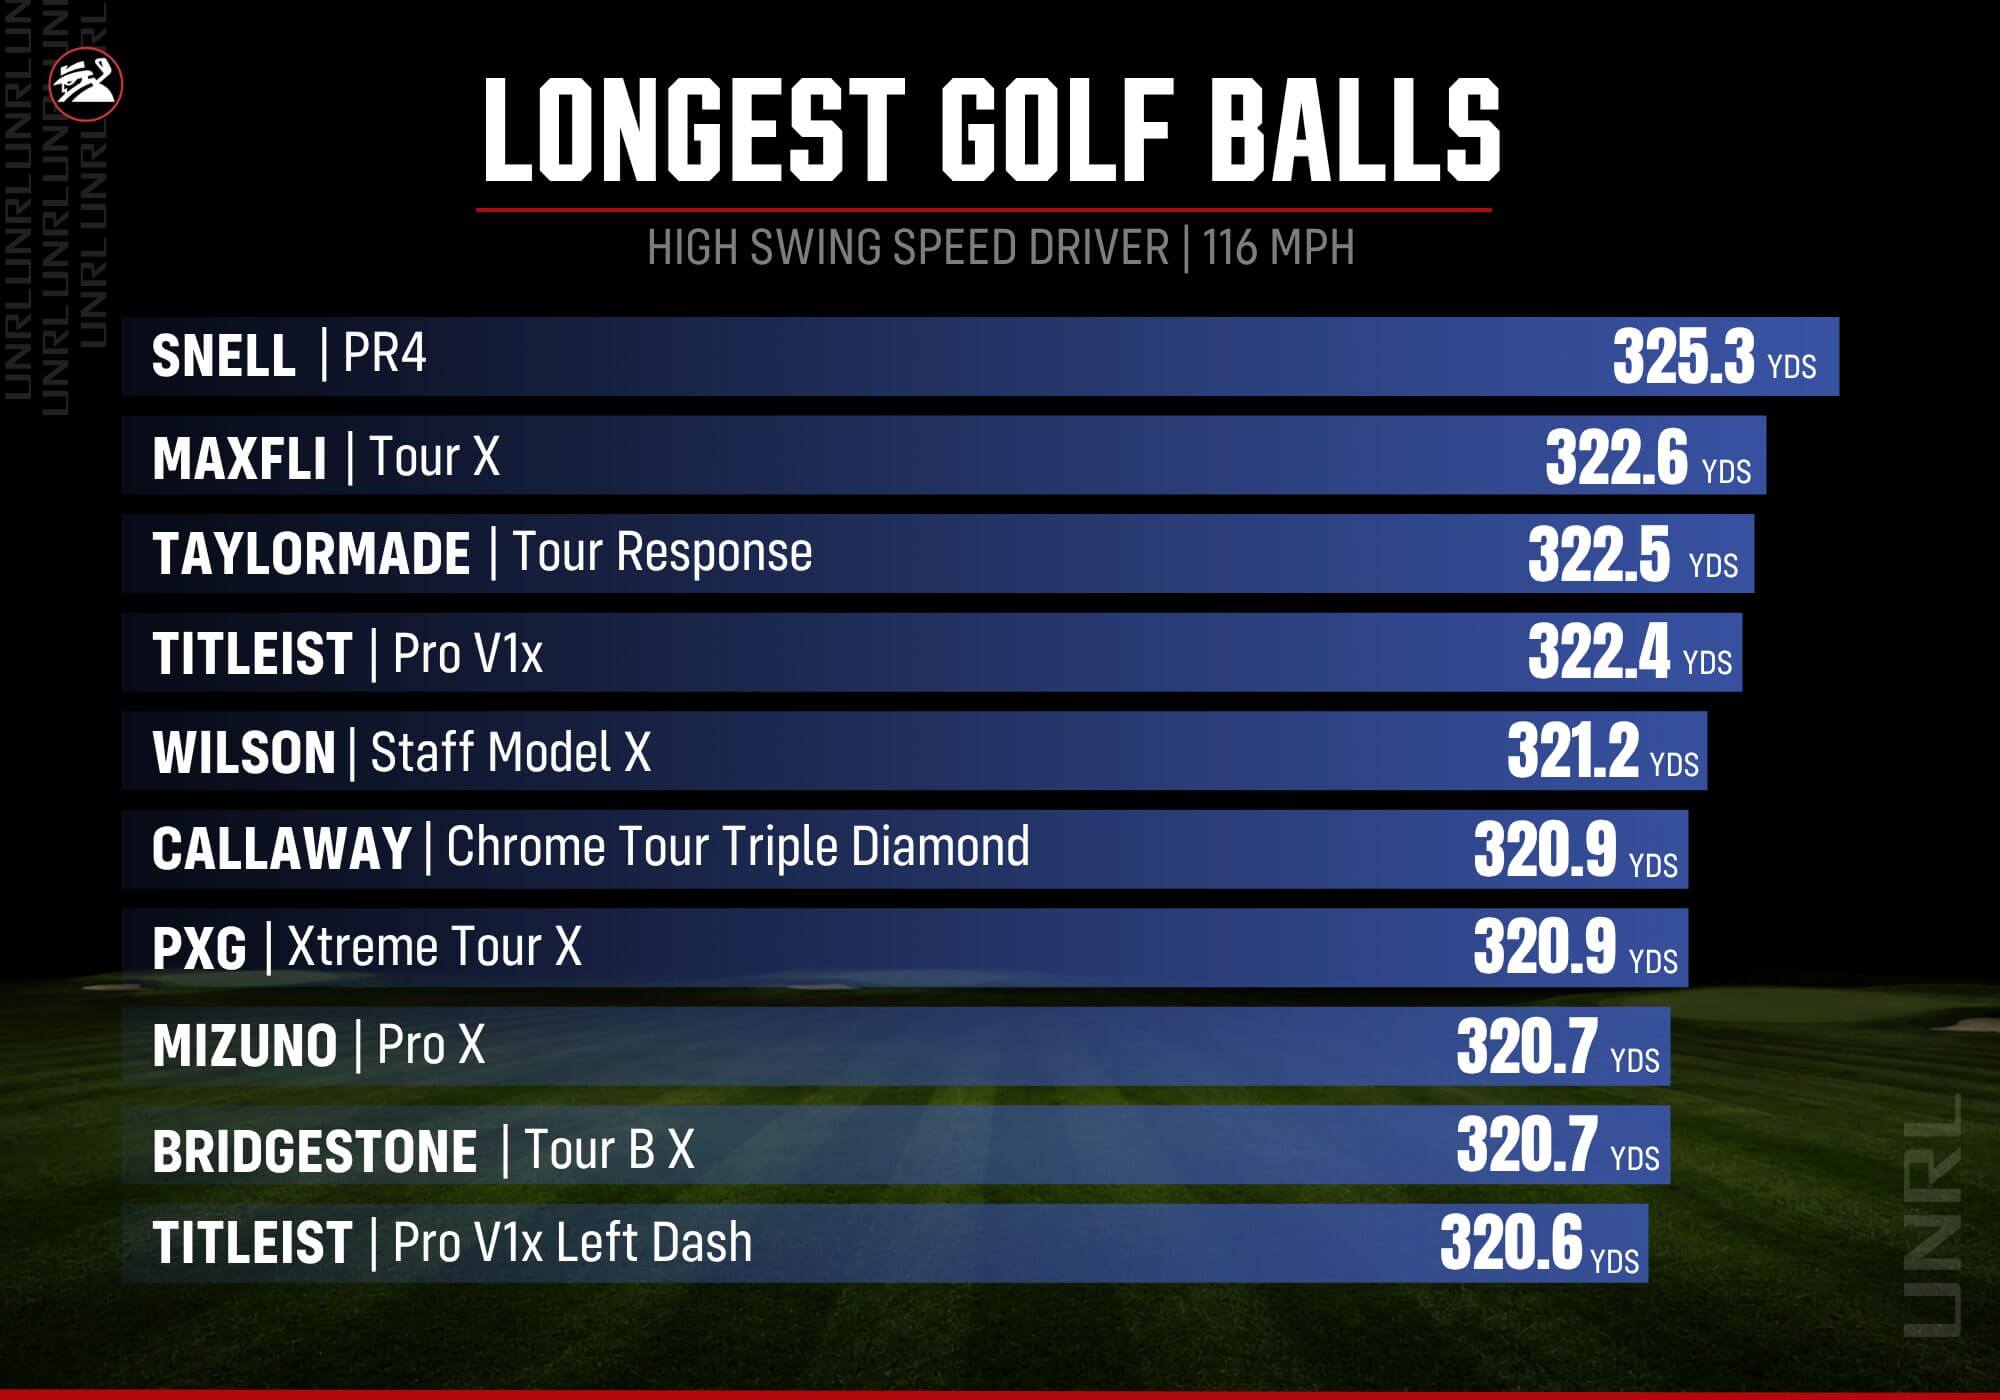
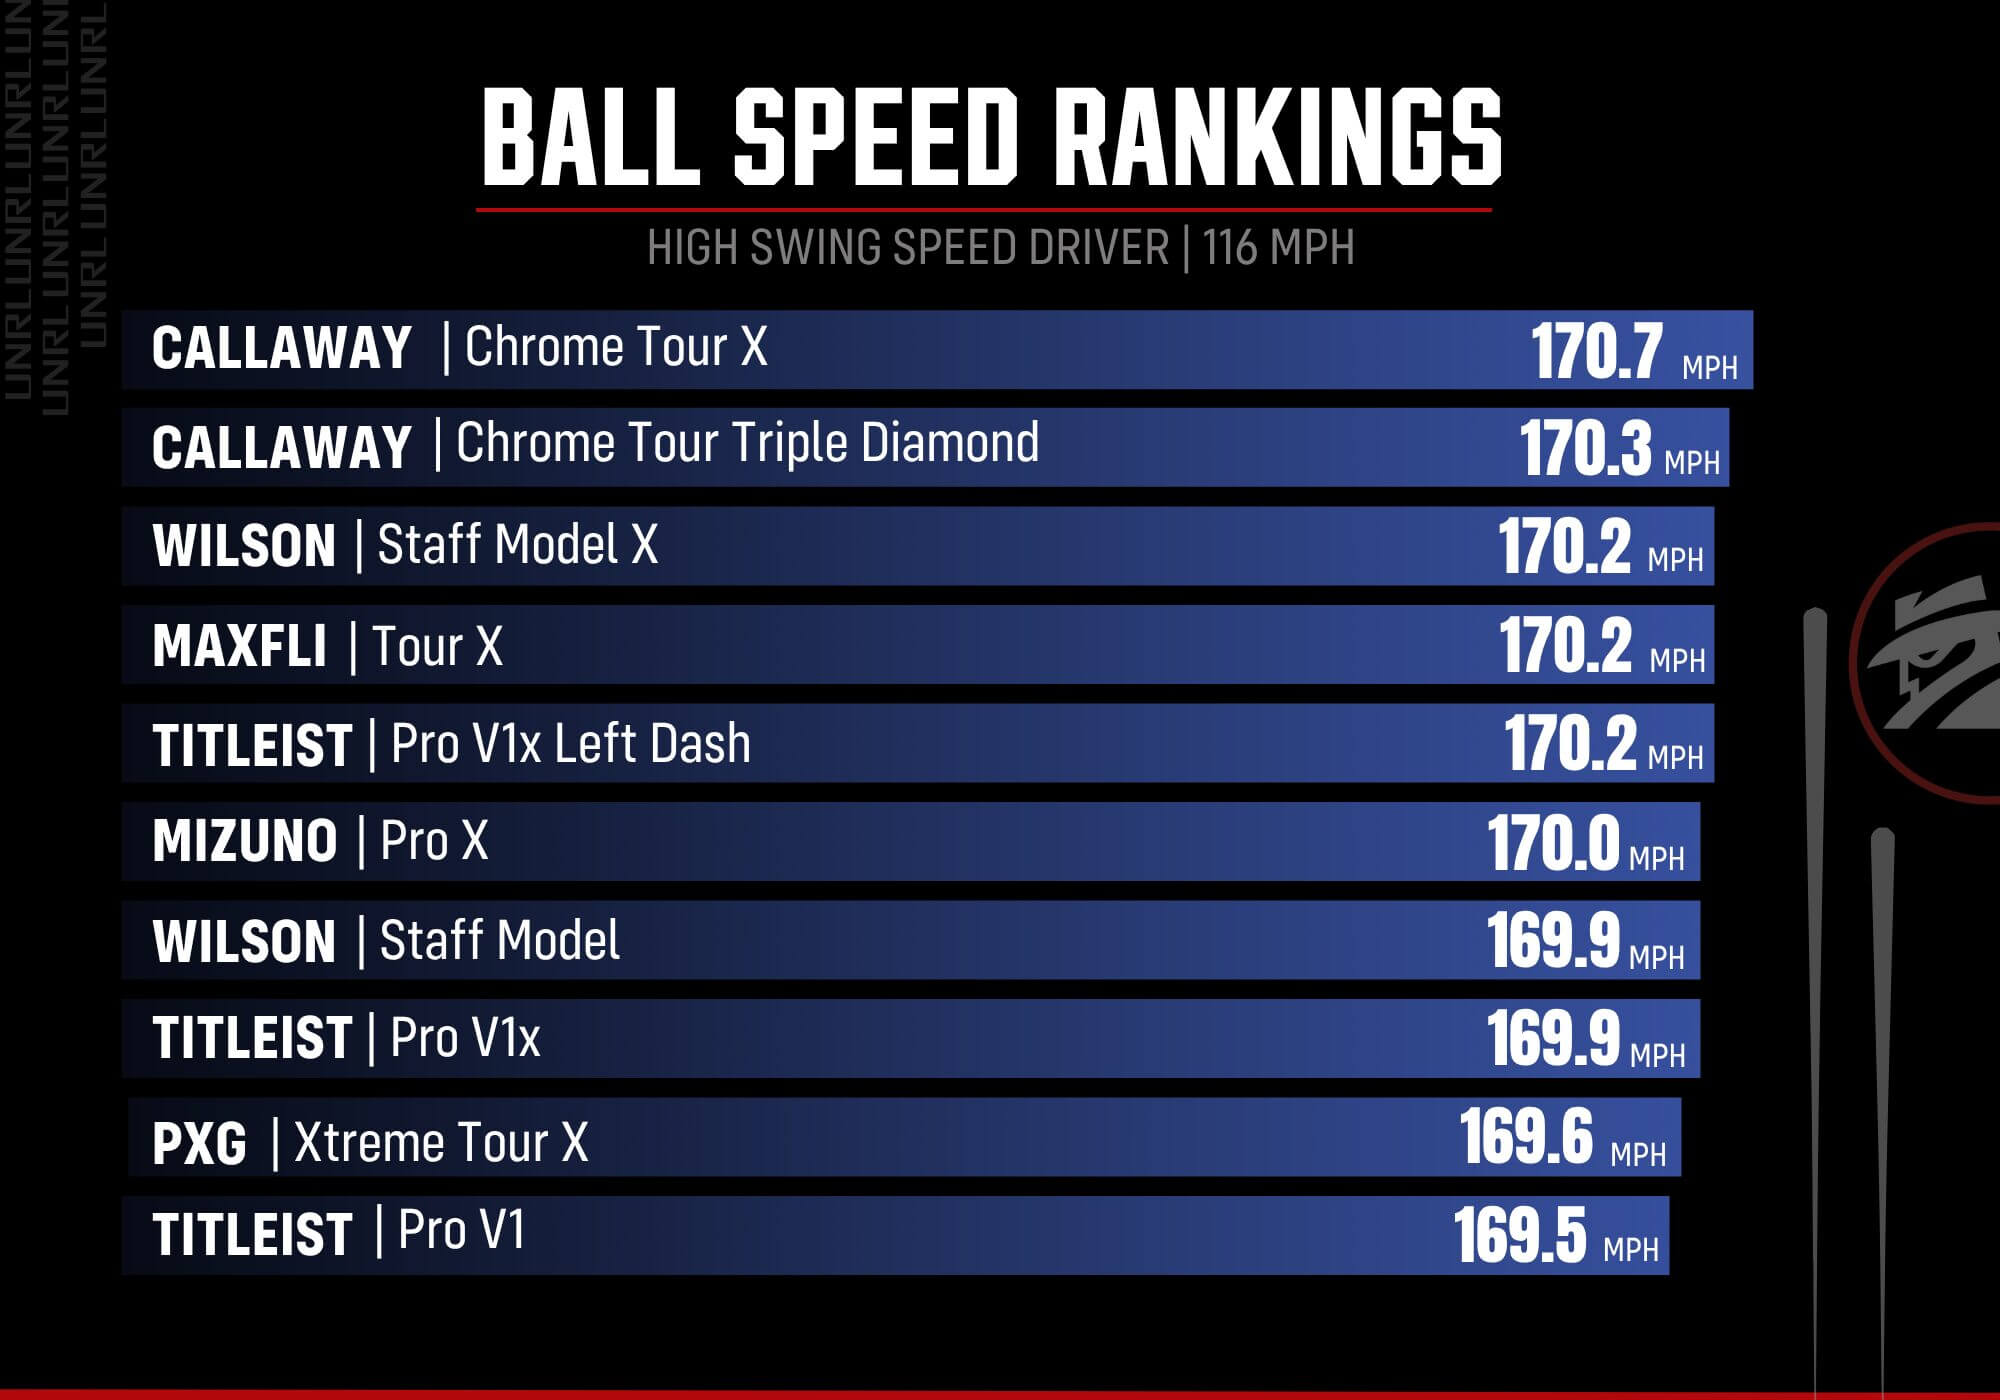
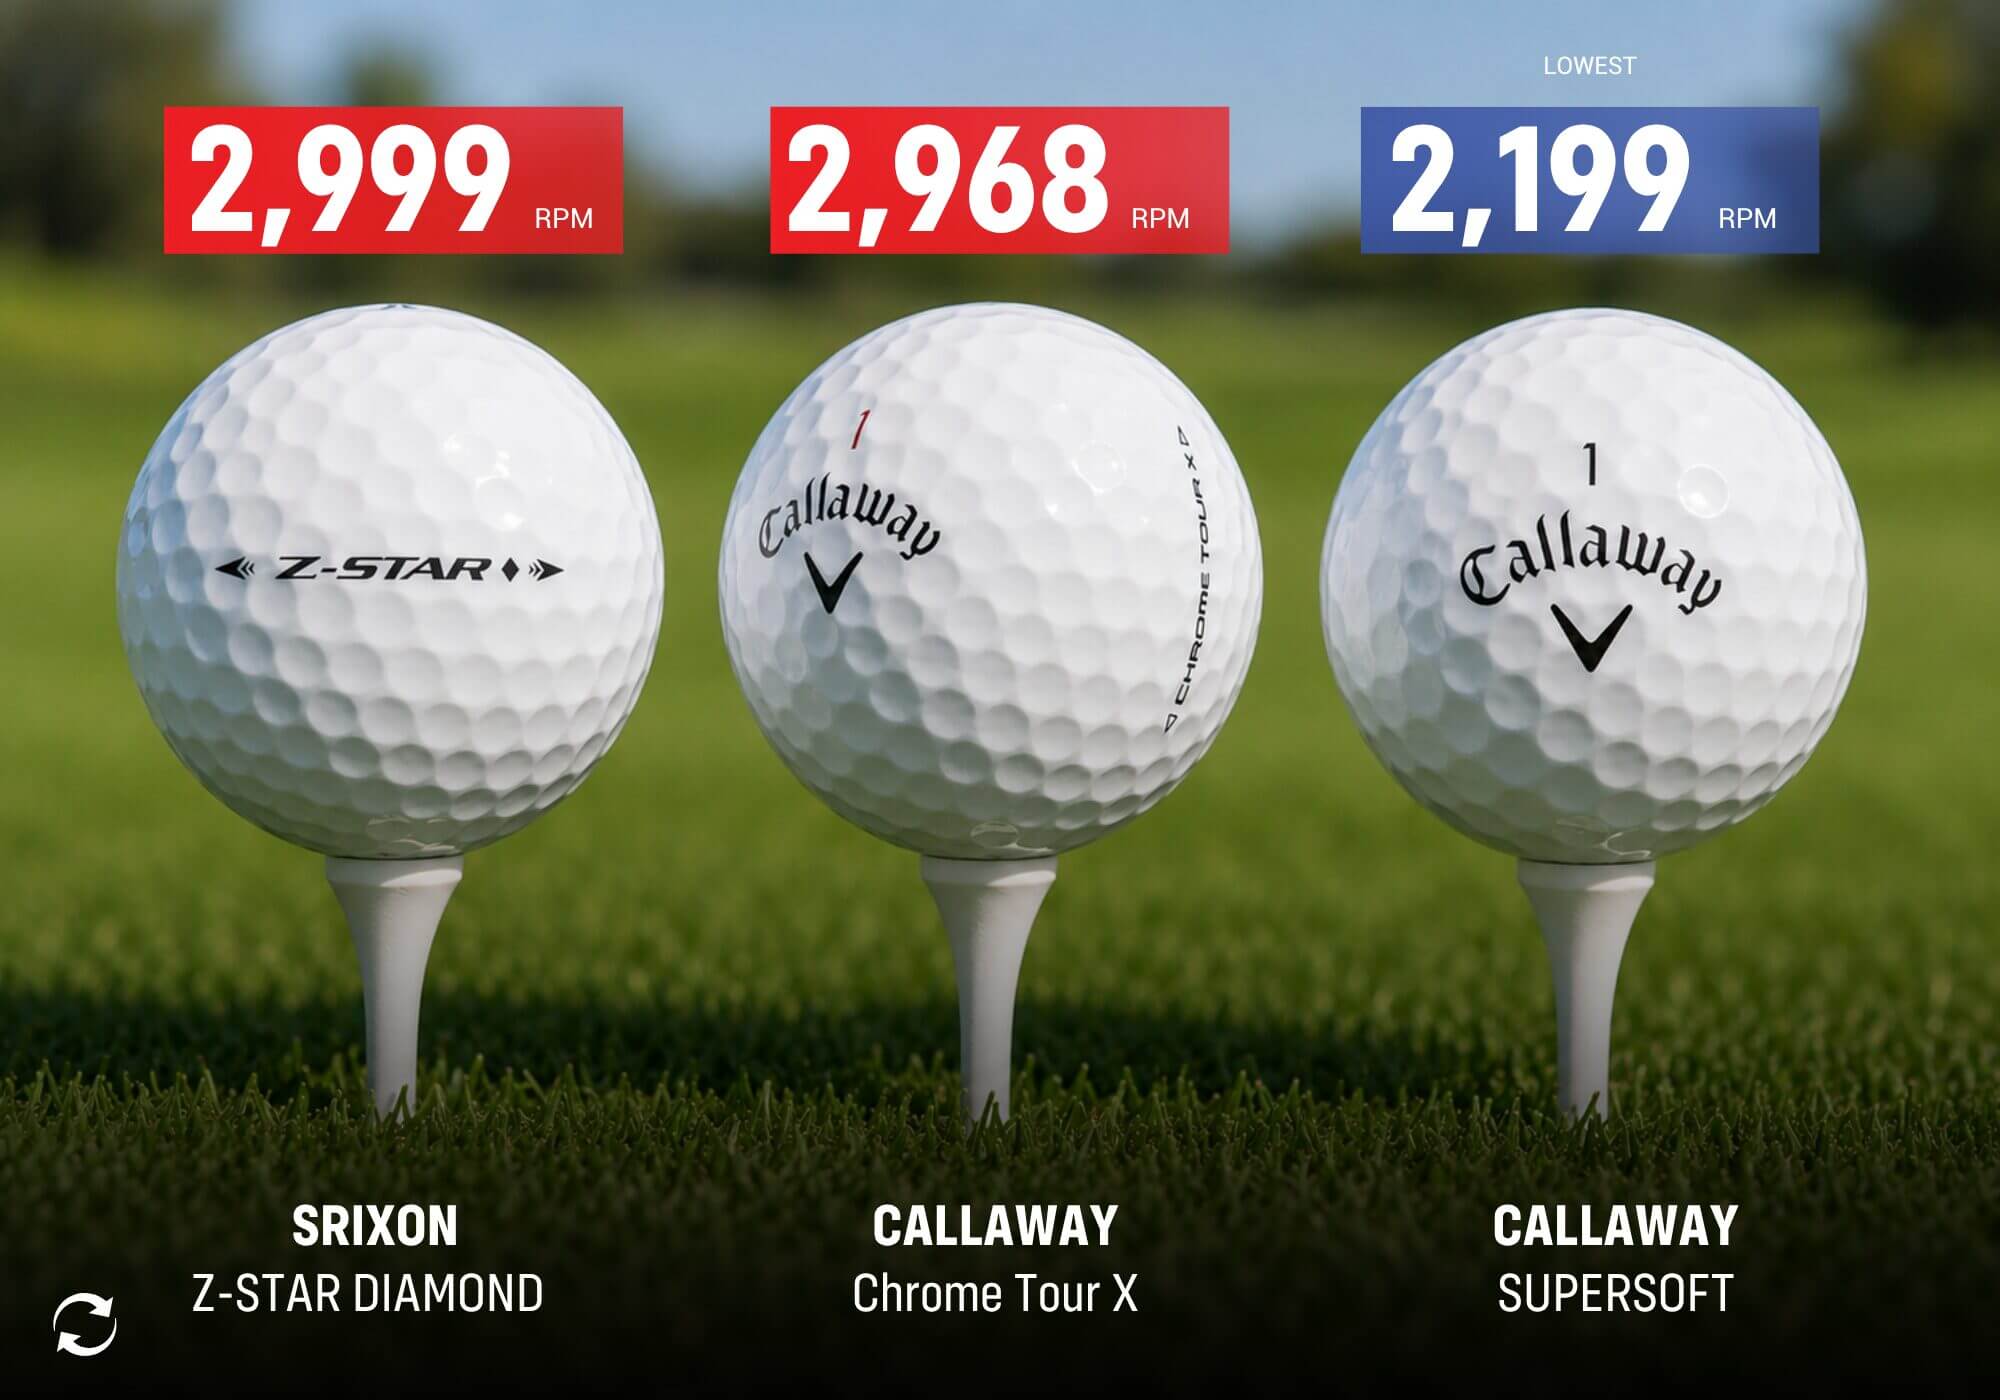
When it comes to the driver, low spin can be your friend as it will often result in straighter shots (assuming manufacturing quality is sound). It’s a good bit of the reason why low-compression balls are sometimes described as more forgiving.
| Test Parameter | Test Median (All Balls) |
|---|---|
| Club Used: Titleist T100 | Ball Speed: 124 |
| Swing Speed: 90 | Total Distance: 182.5 |
| Calibration Launch Target: 17 | Launch Angle: 18 |
| Calibration Spin Target: 6500 | Spin: 6316 |
To arrive at our picks, we considered key performance metrics like ball speed, trajectory, spin rate and distance. The mid-speed recommendations below are based on a combination of driver and iron performance.
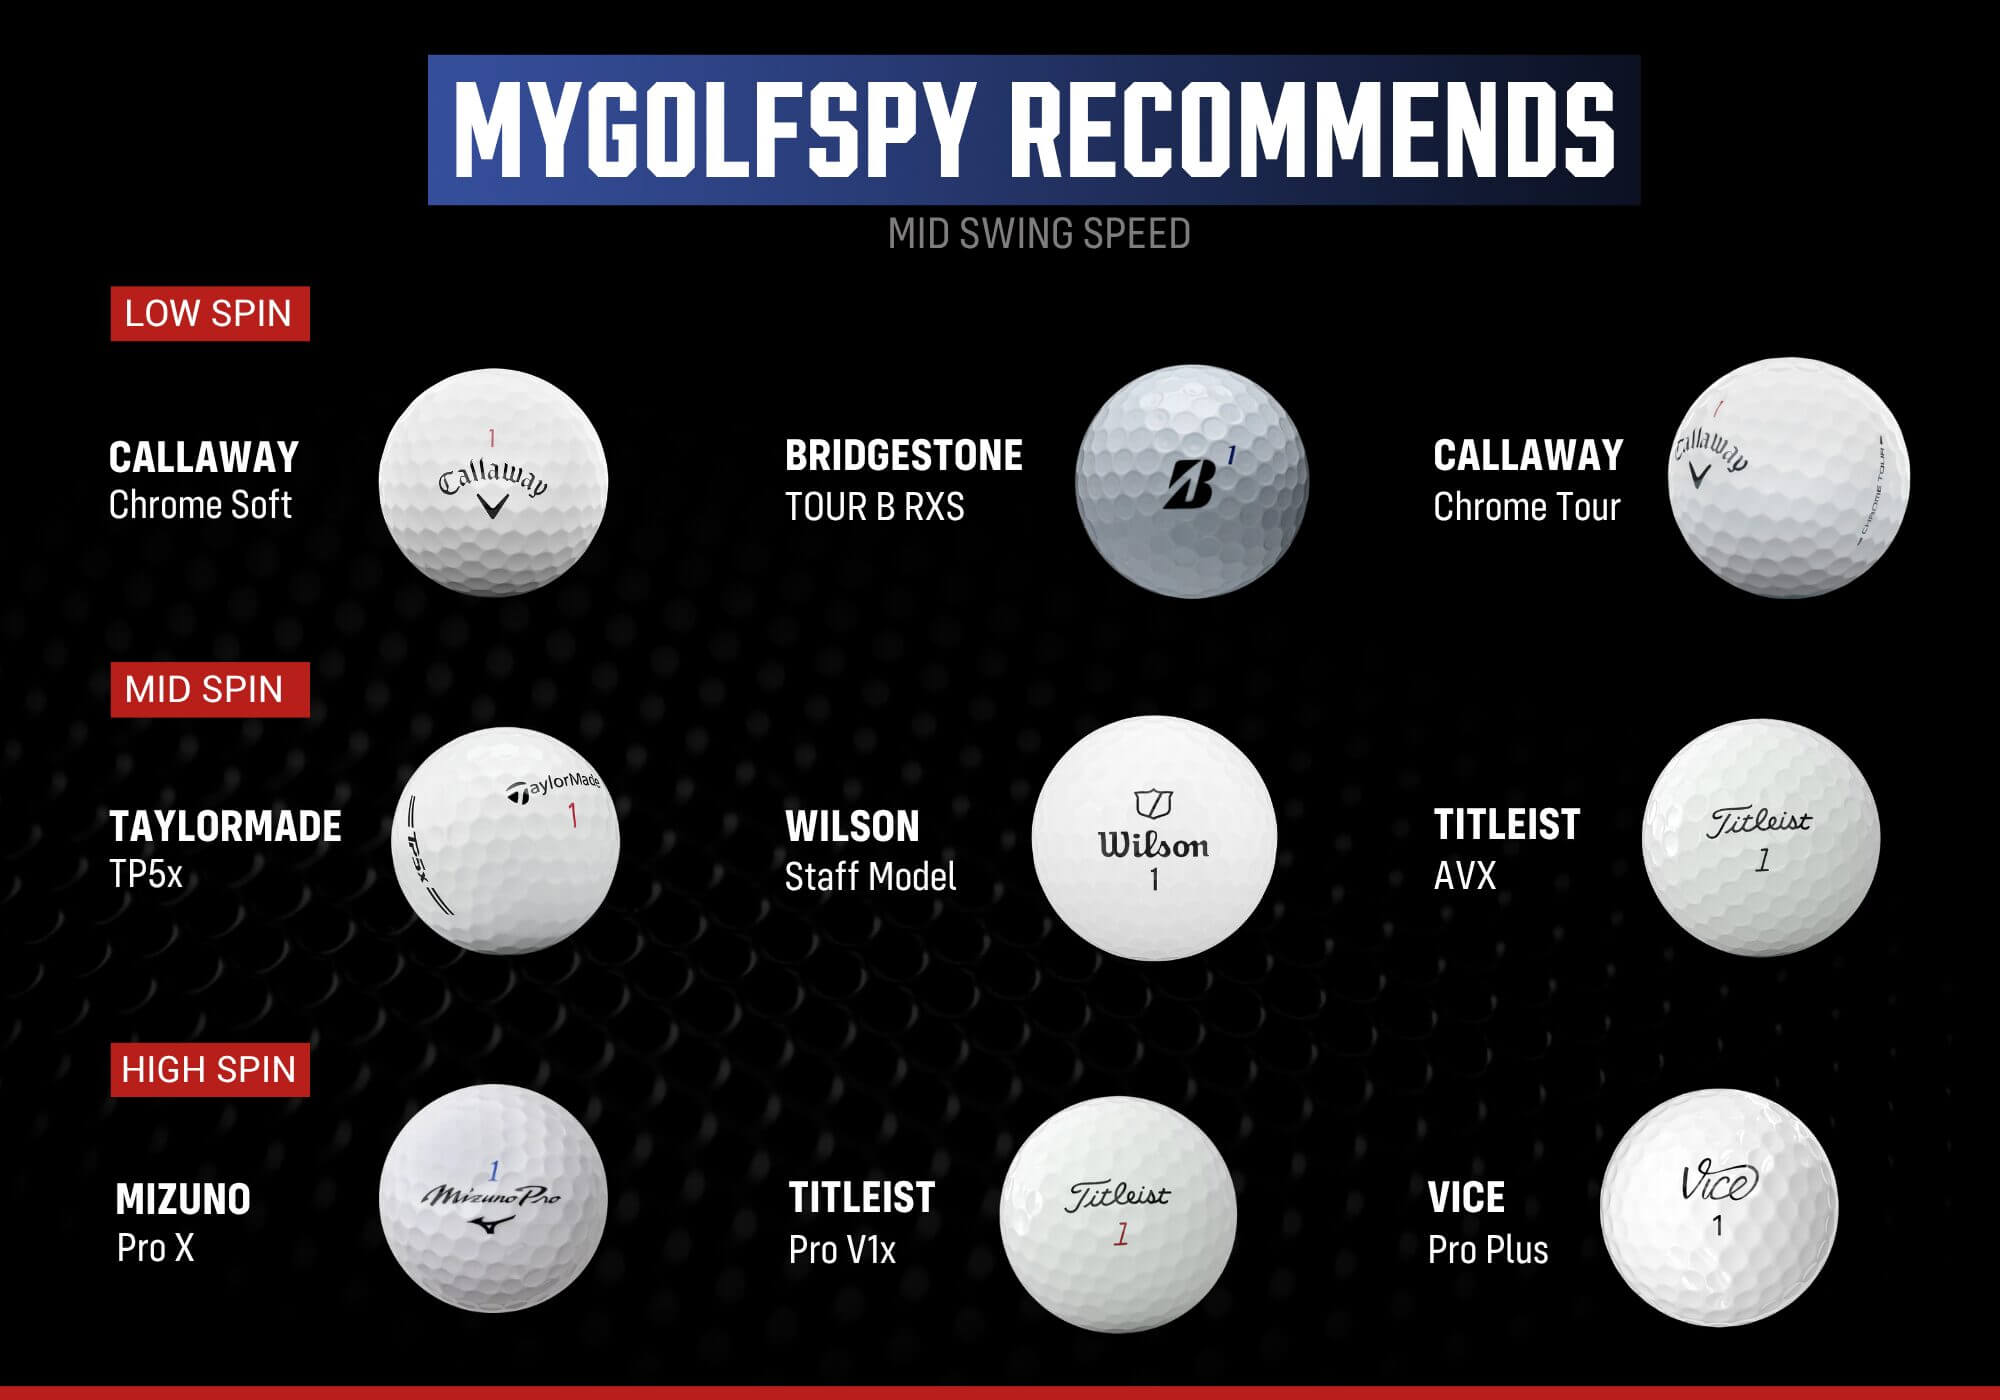
Low Spin – Callaway Chrome Soft, Bridgestone TOUR B RXS, Callaway Chrome Tour
Mid Spin – TaylorMade TP5x, Wilson Staff Model, Titleist AVX
High Spin – Mizuno Pro X, Titleist Pro V1x, Vice Pro Plus
Great Buy – Vice Pro
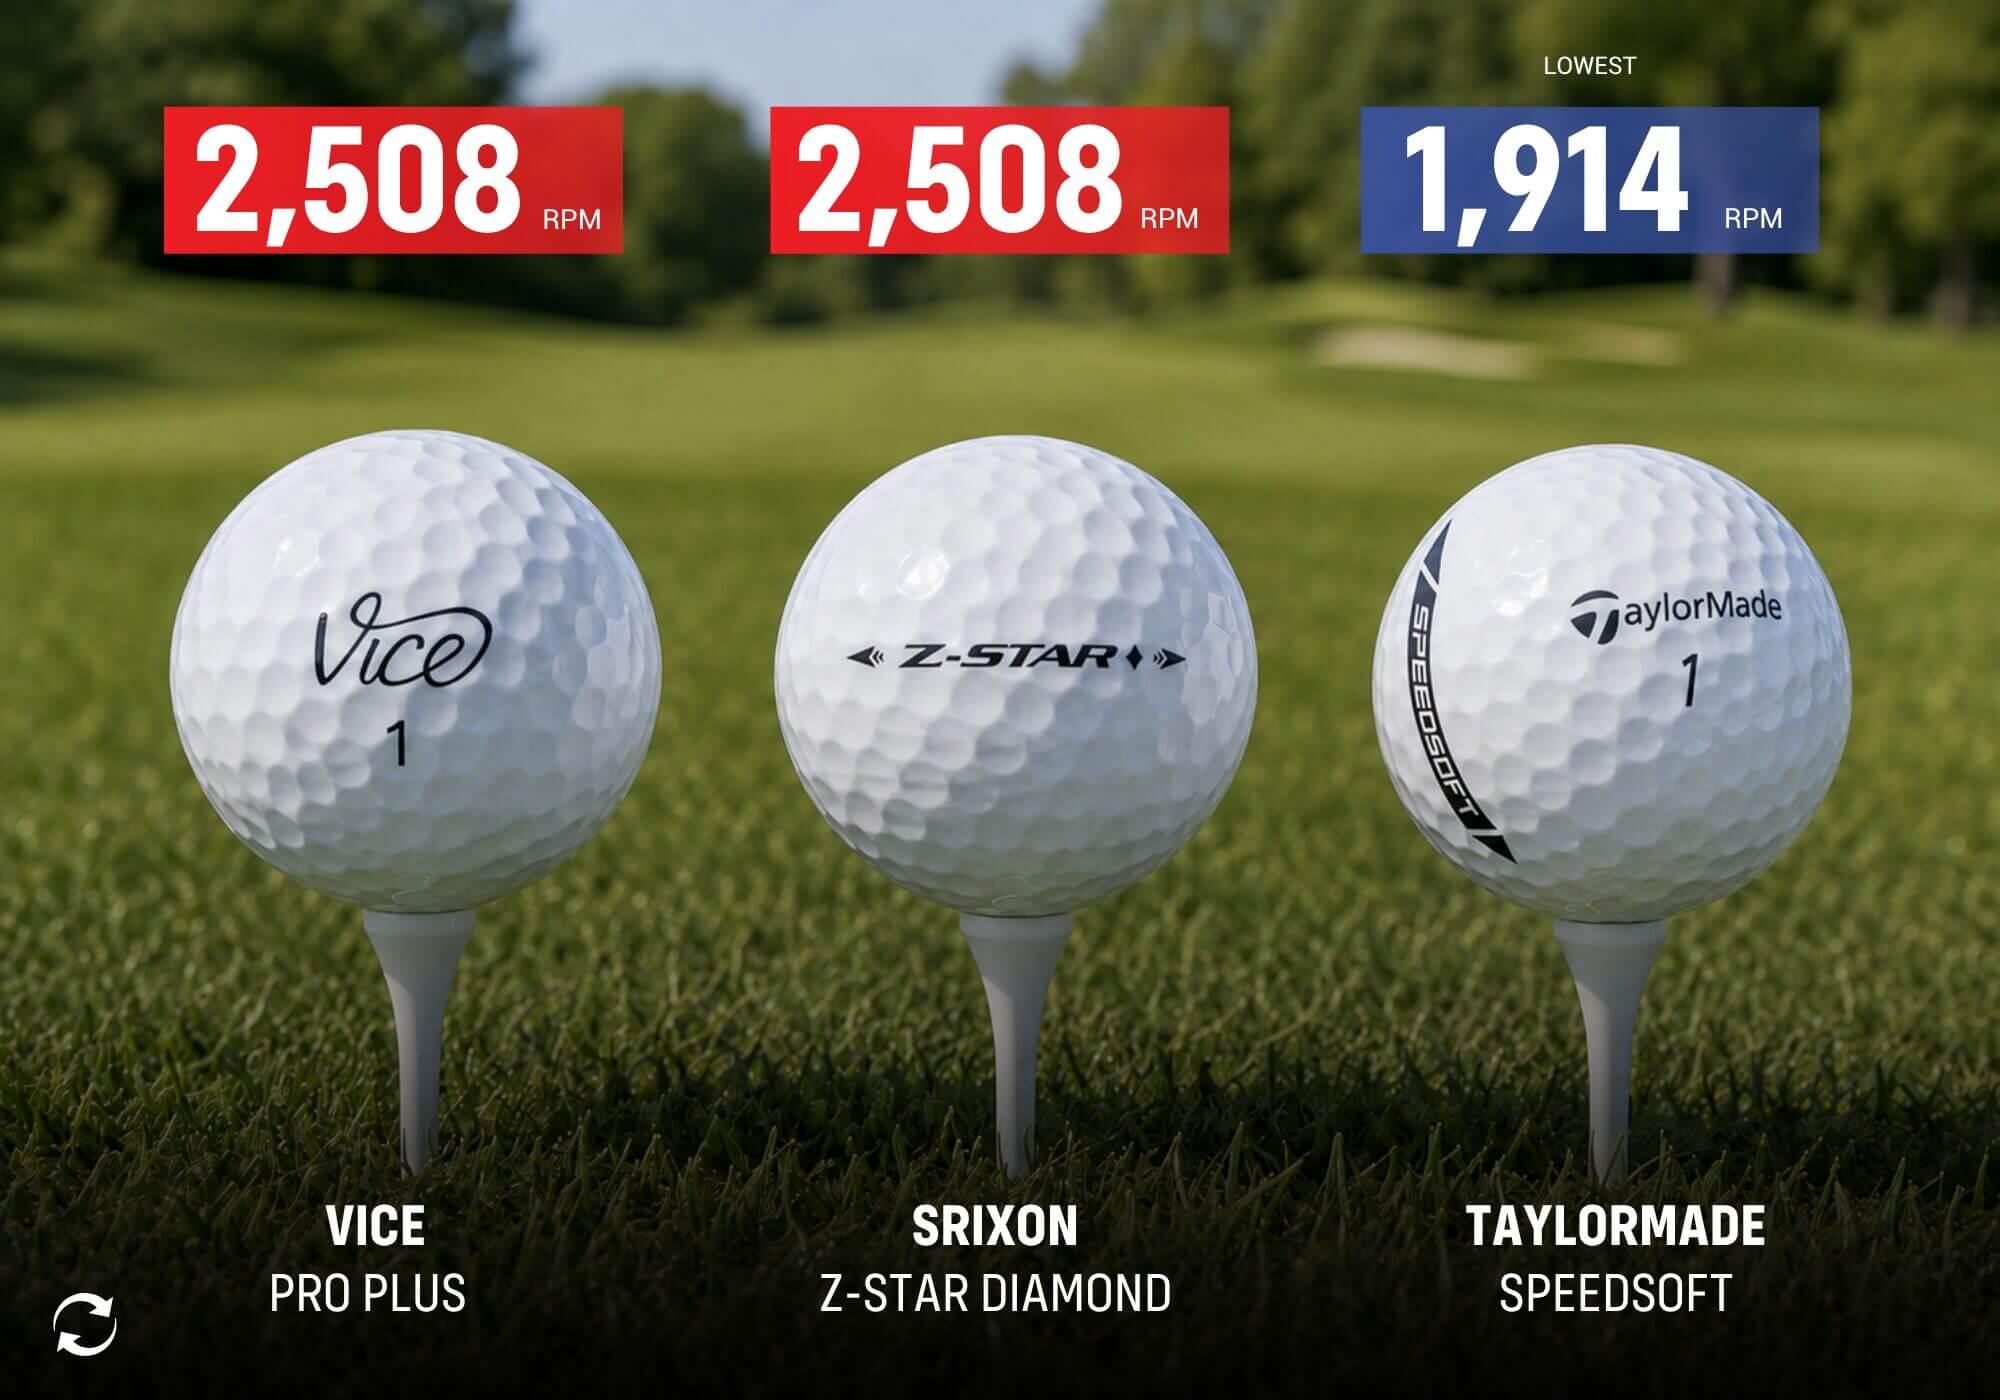
Ionomer – TaylorMade SpeedSoft
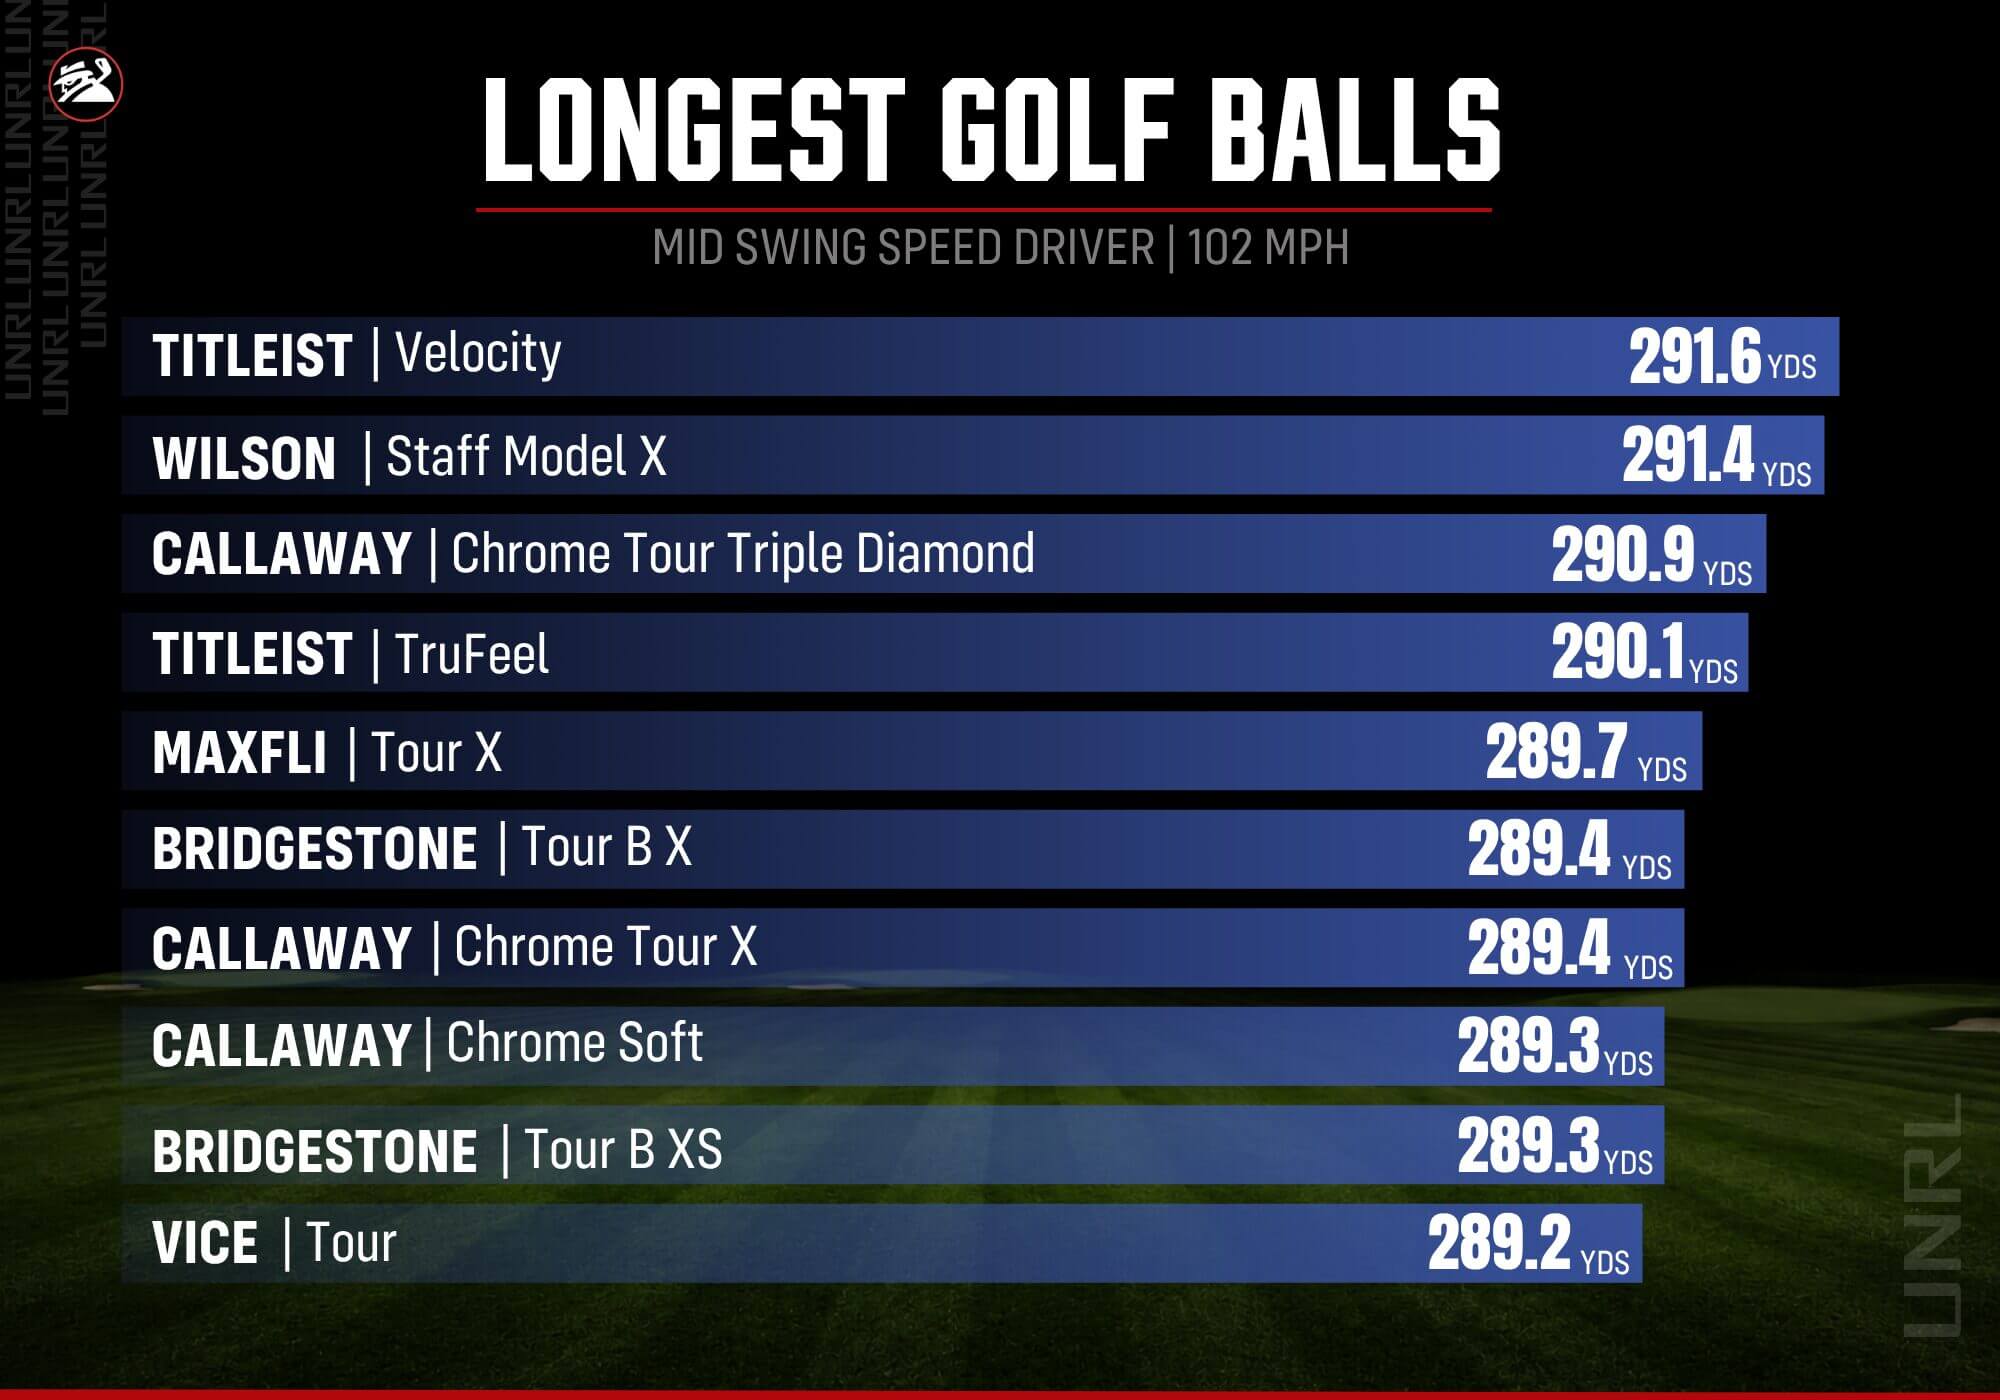
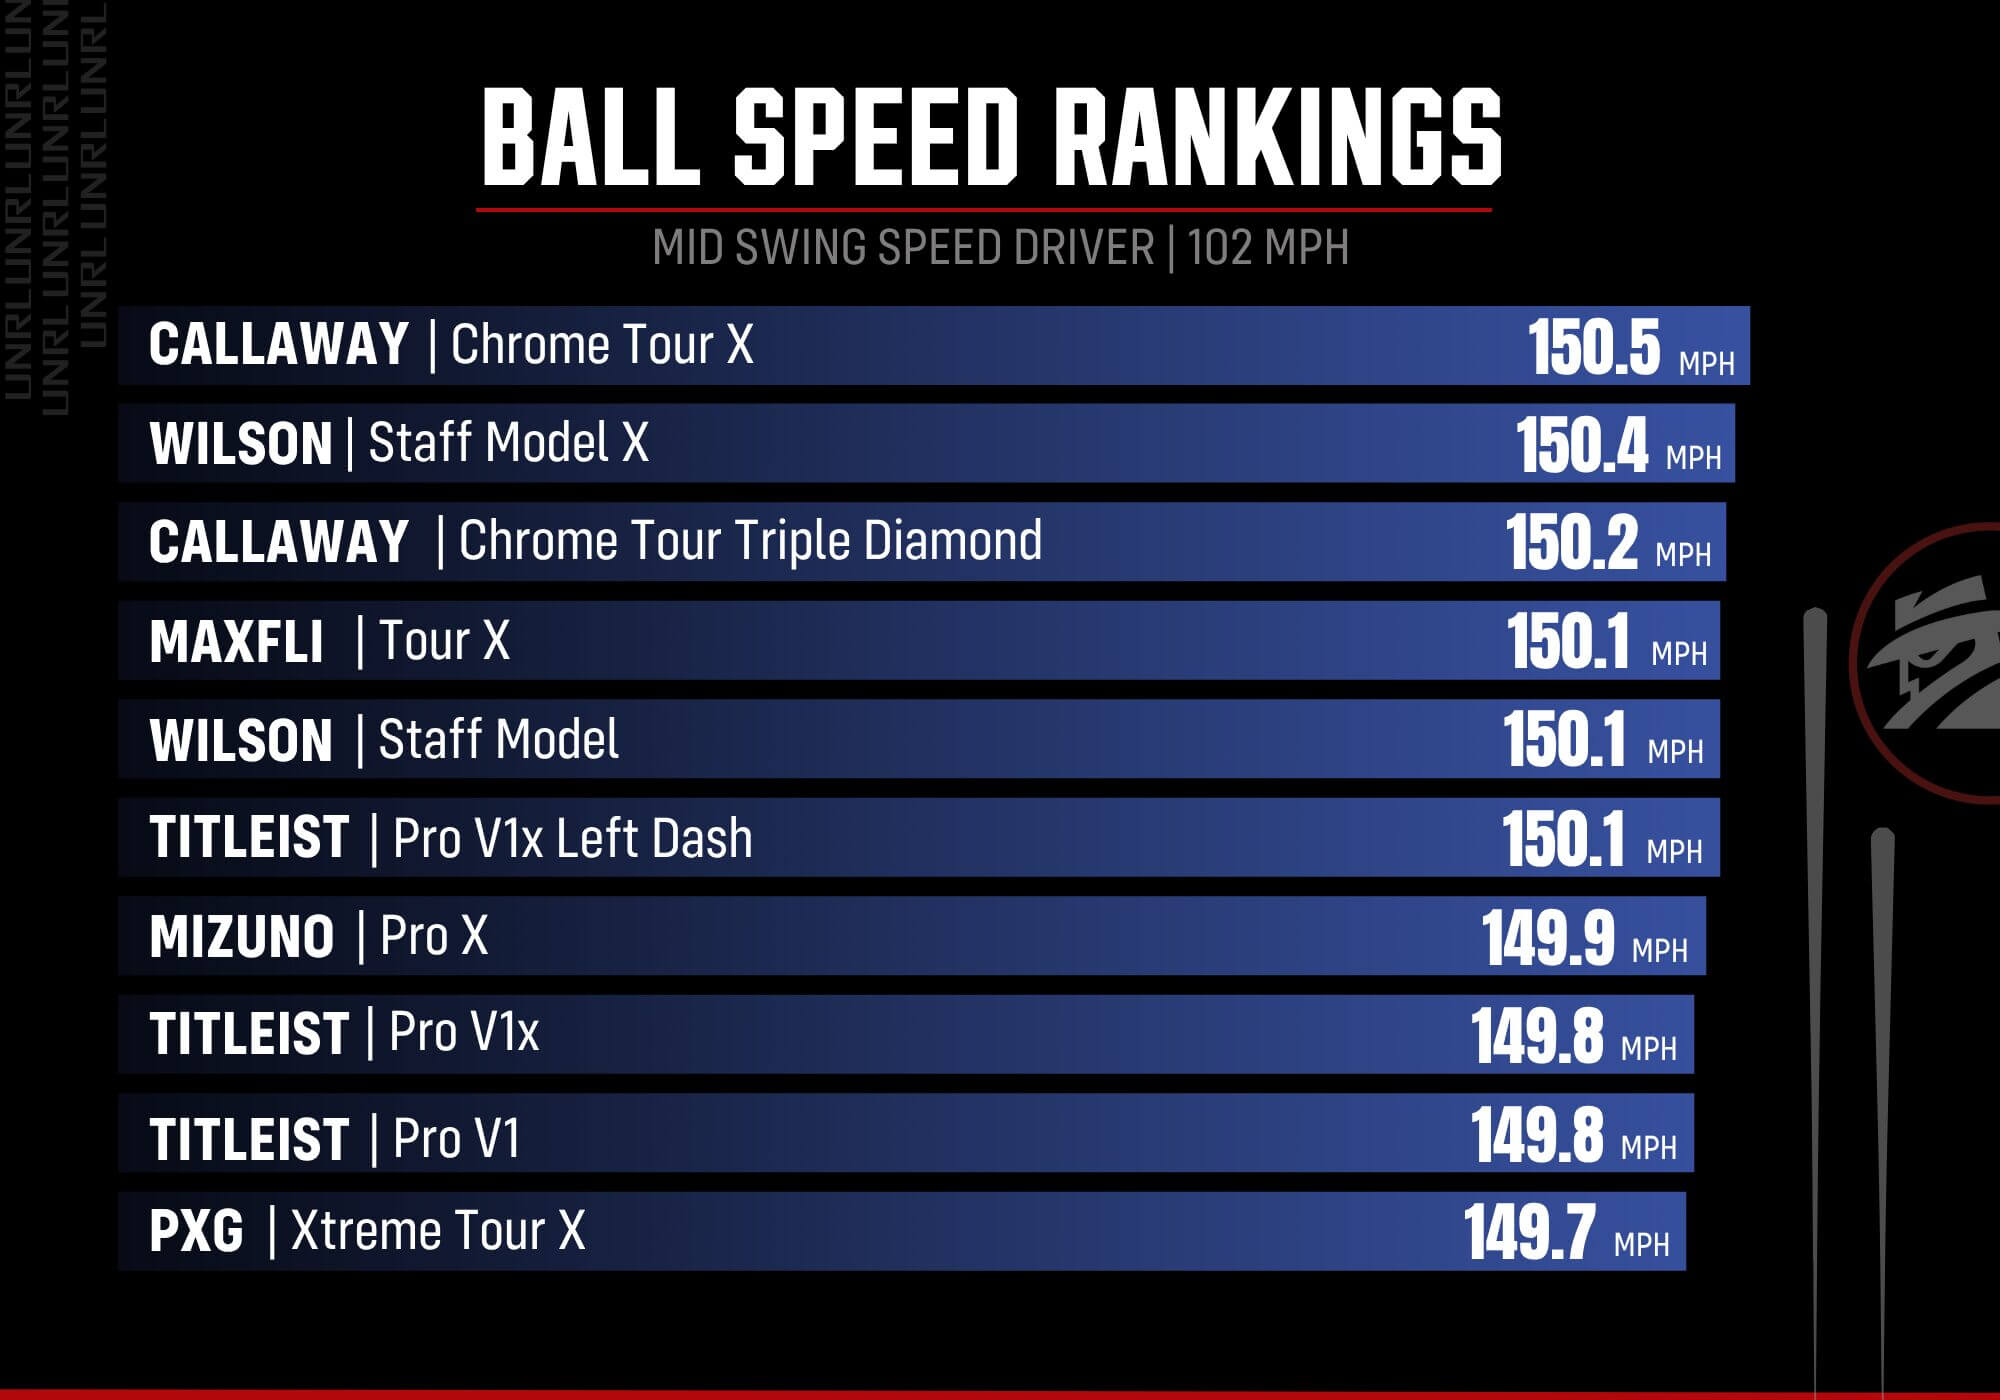
| Test Parameter | Test Average (All Balls) |
|---|---|
| Driver Used: PXG Black Ops | Ball Speed: 149.03 |
| Swing Speed: 102 | Total Distance: 282.79 |
| Calibration Launch Target: 13 | Launch Angle: 12.25 |
| Calibration Spin Target: 2600 | Spin: 2441 |
| Test Parameter | Test Average (All Balls) |
|---|---|
| Club Used: Titleist T100 | Ball Speed: 112.1 |
| Swing Speed: 80 | Carry Distance: 158.2 |
| Calibration Launch Target: 19 | Launch Angle: 18.2 |
| Calibration Spin Target: 6000 | Spin: 6064 |
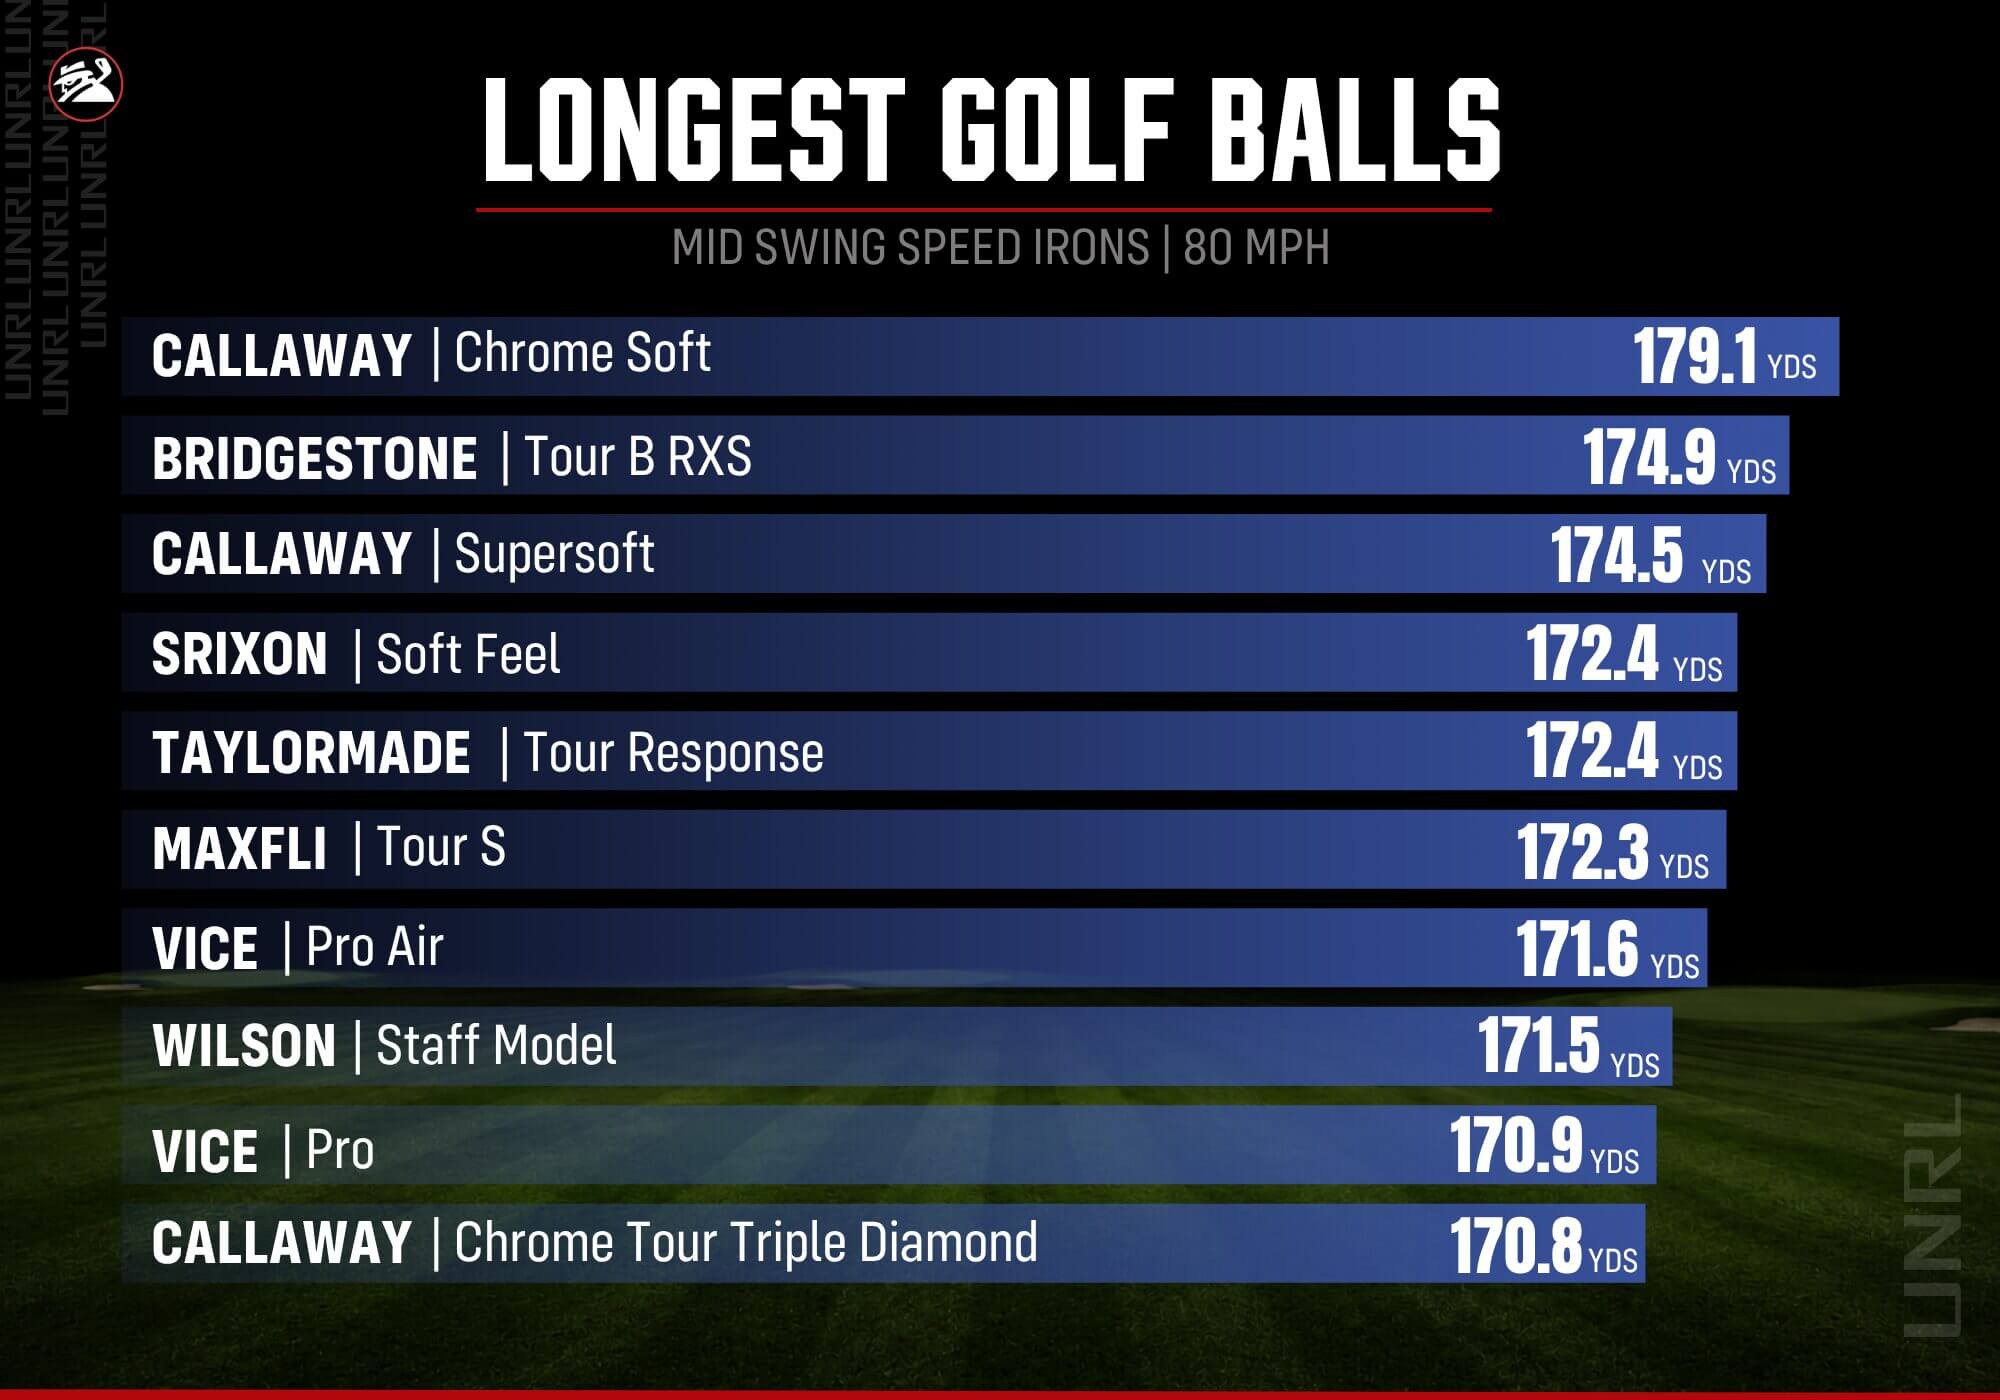
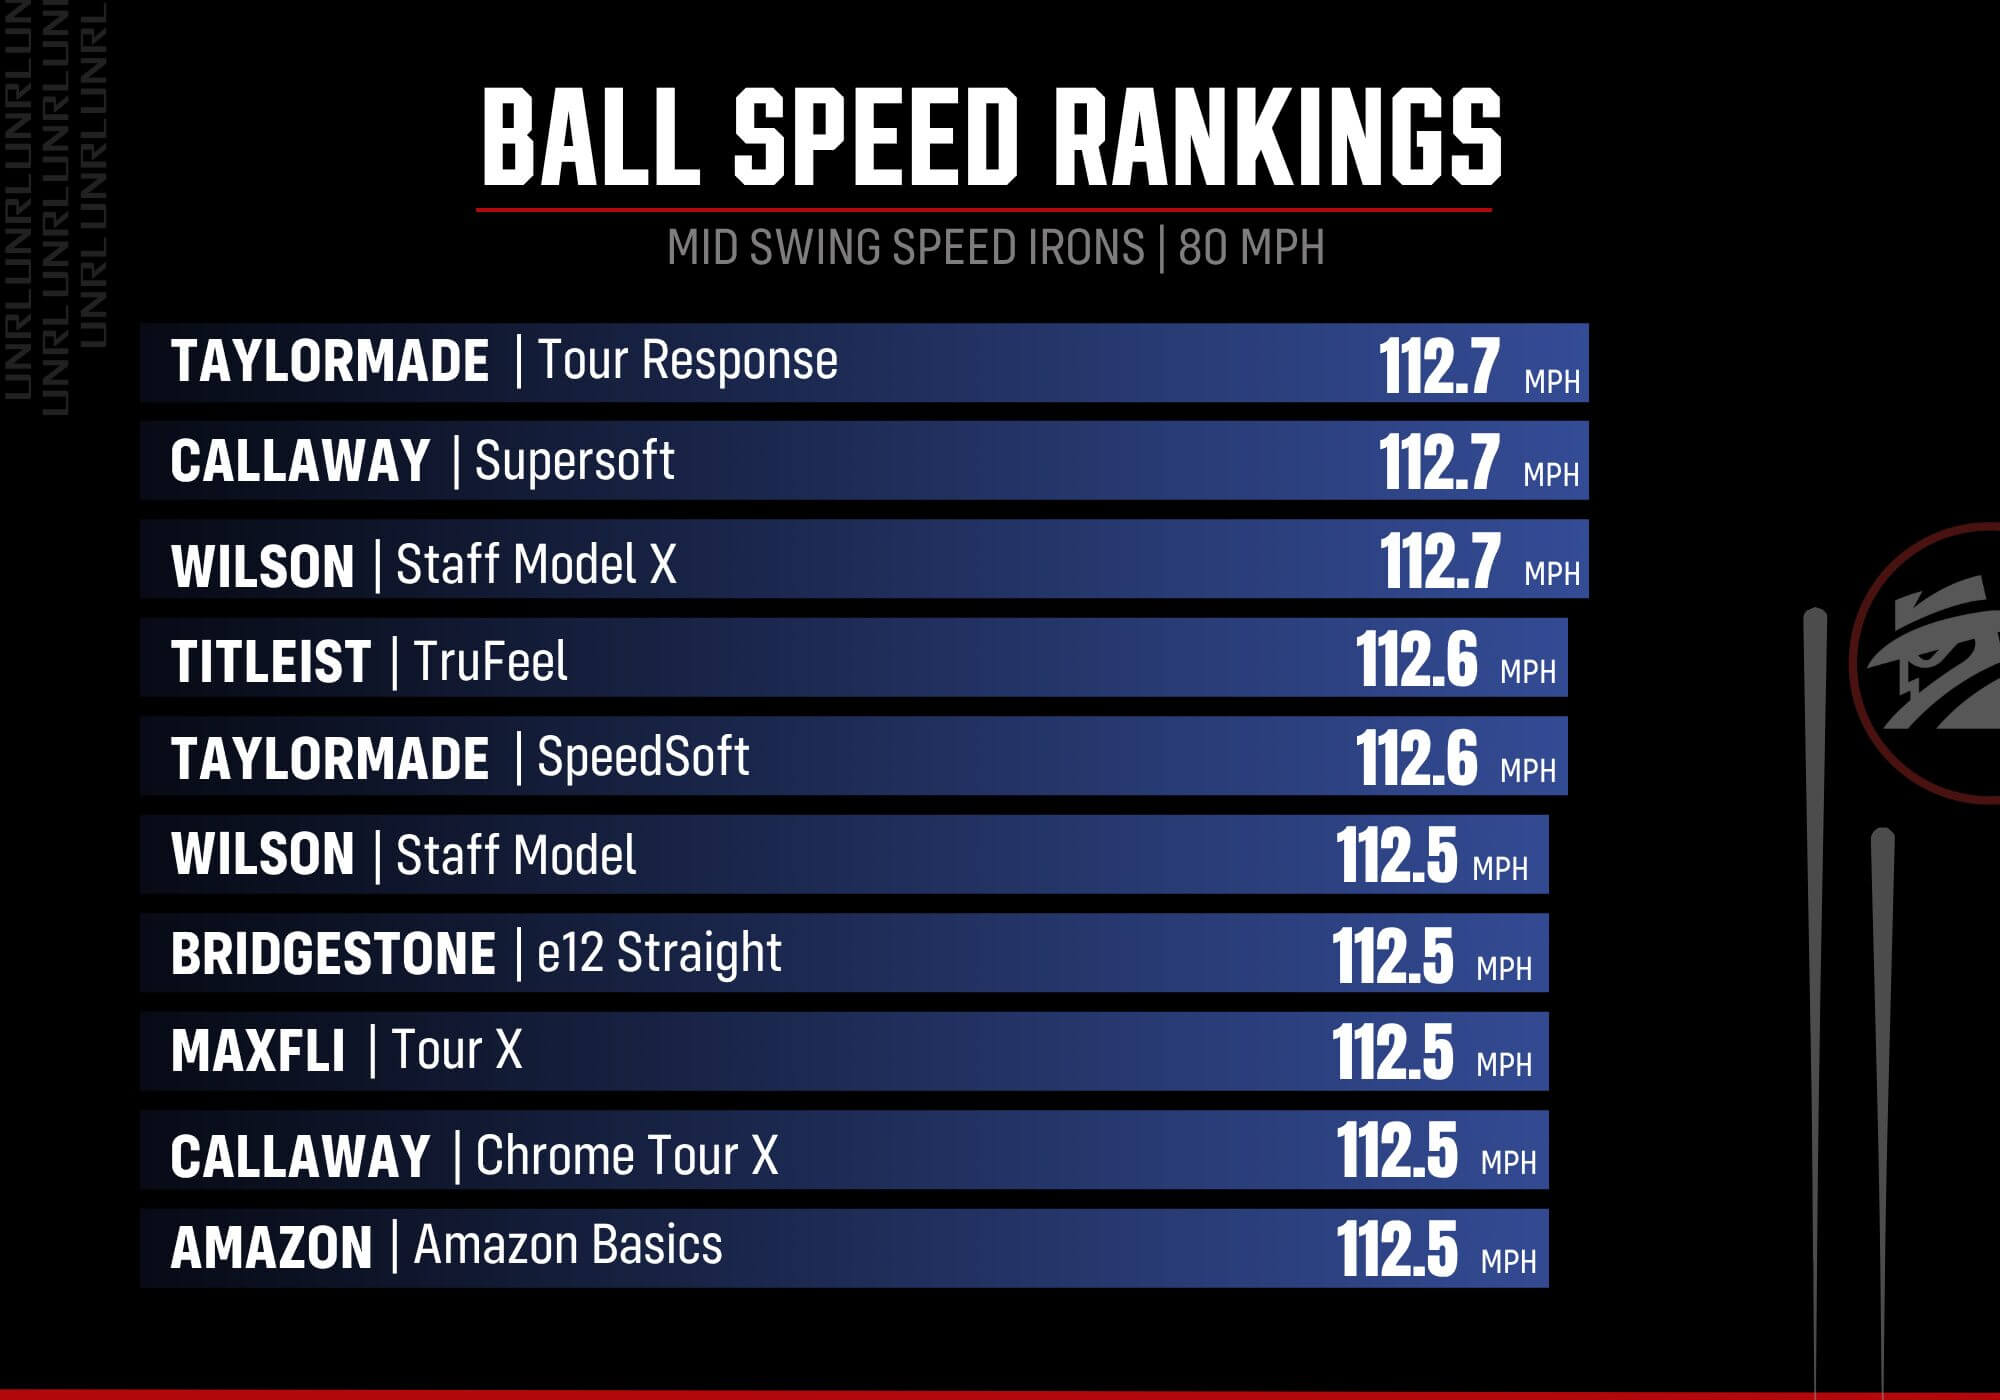
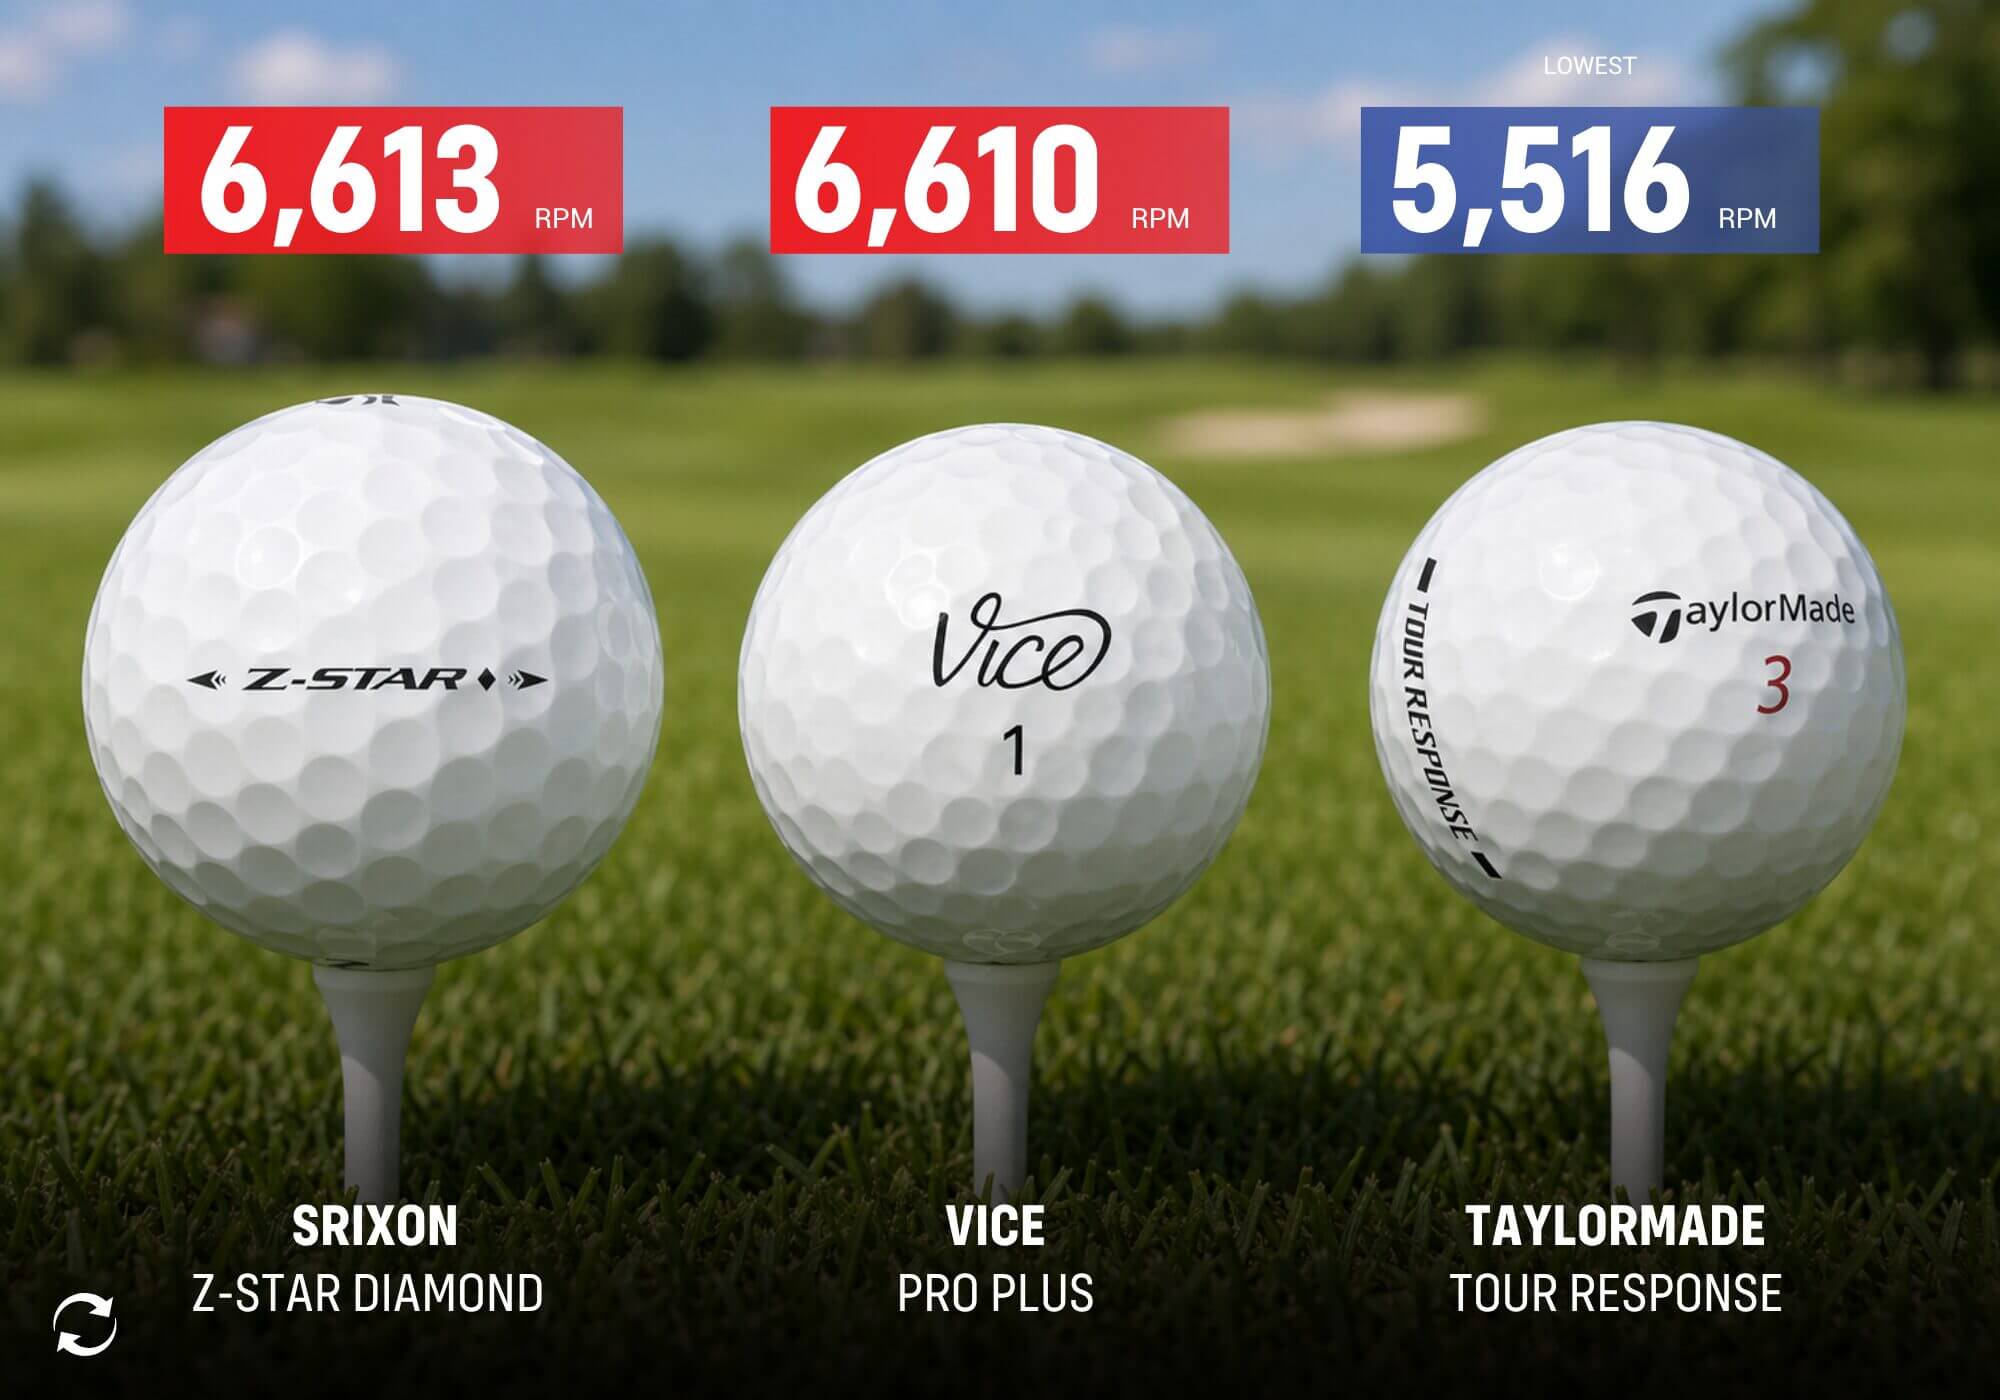
To arrive at our picks, we considered key performance metrics like ball speed, trajectory, spin rate and distance. The low-speed recommendations below are based on a combination of driver and iron performance.
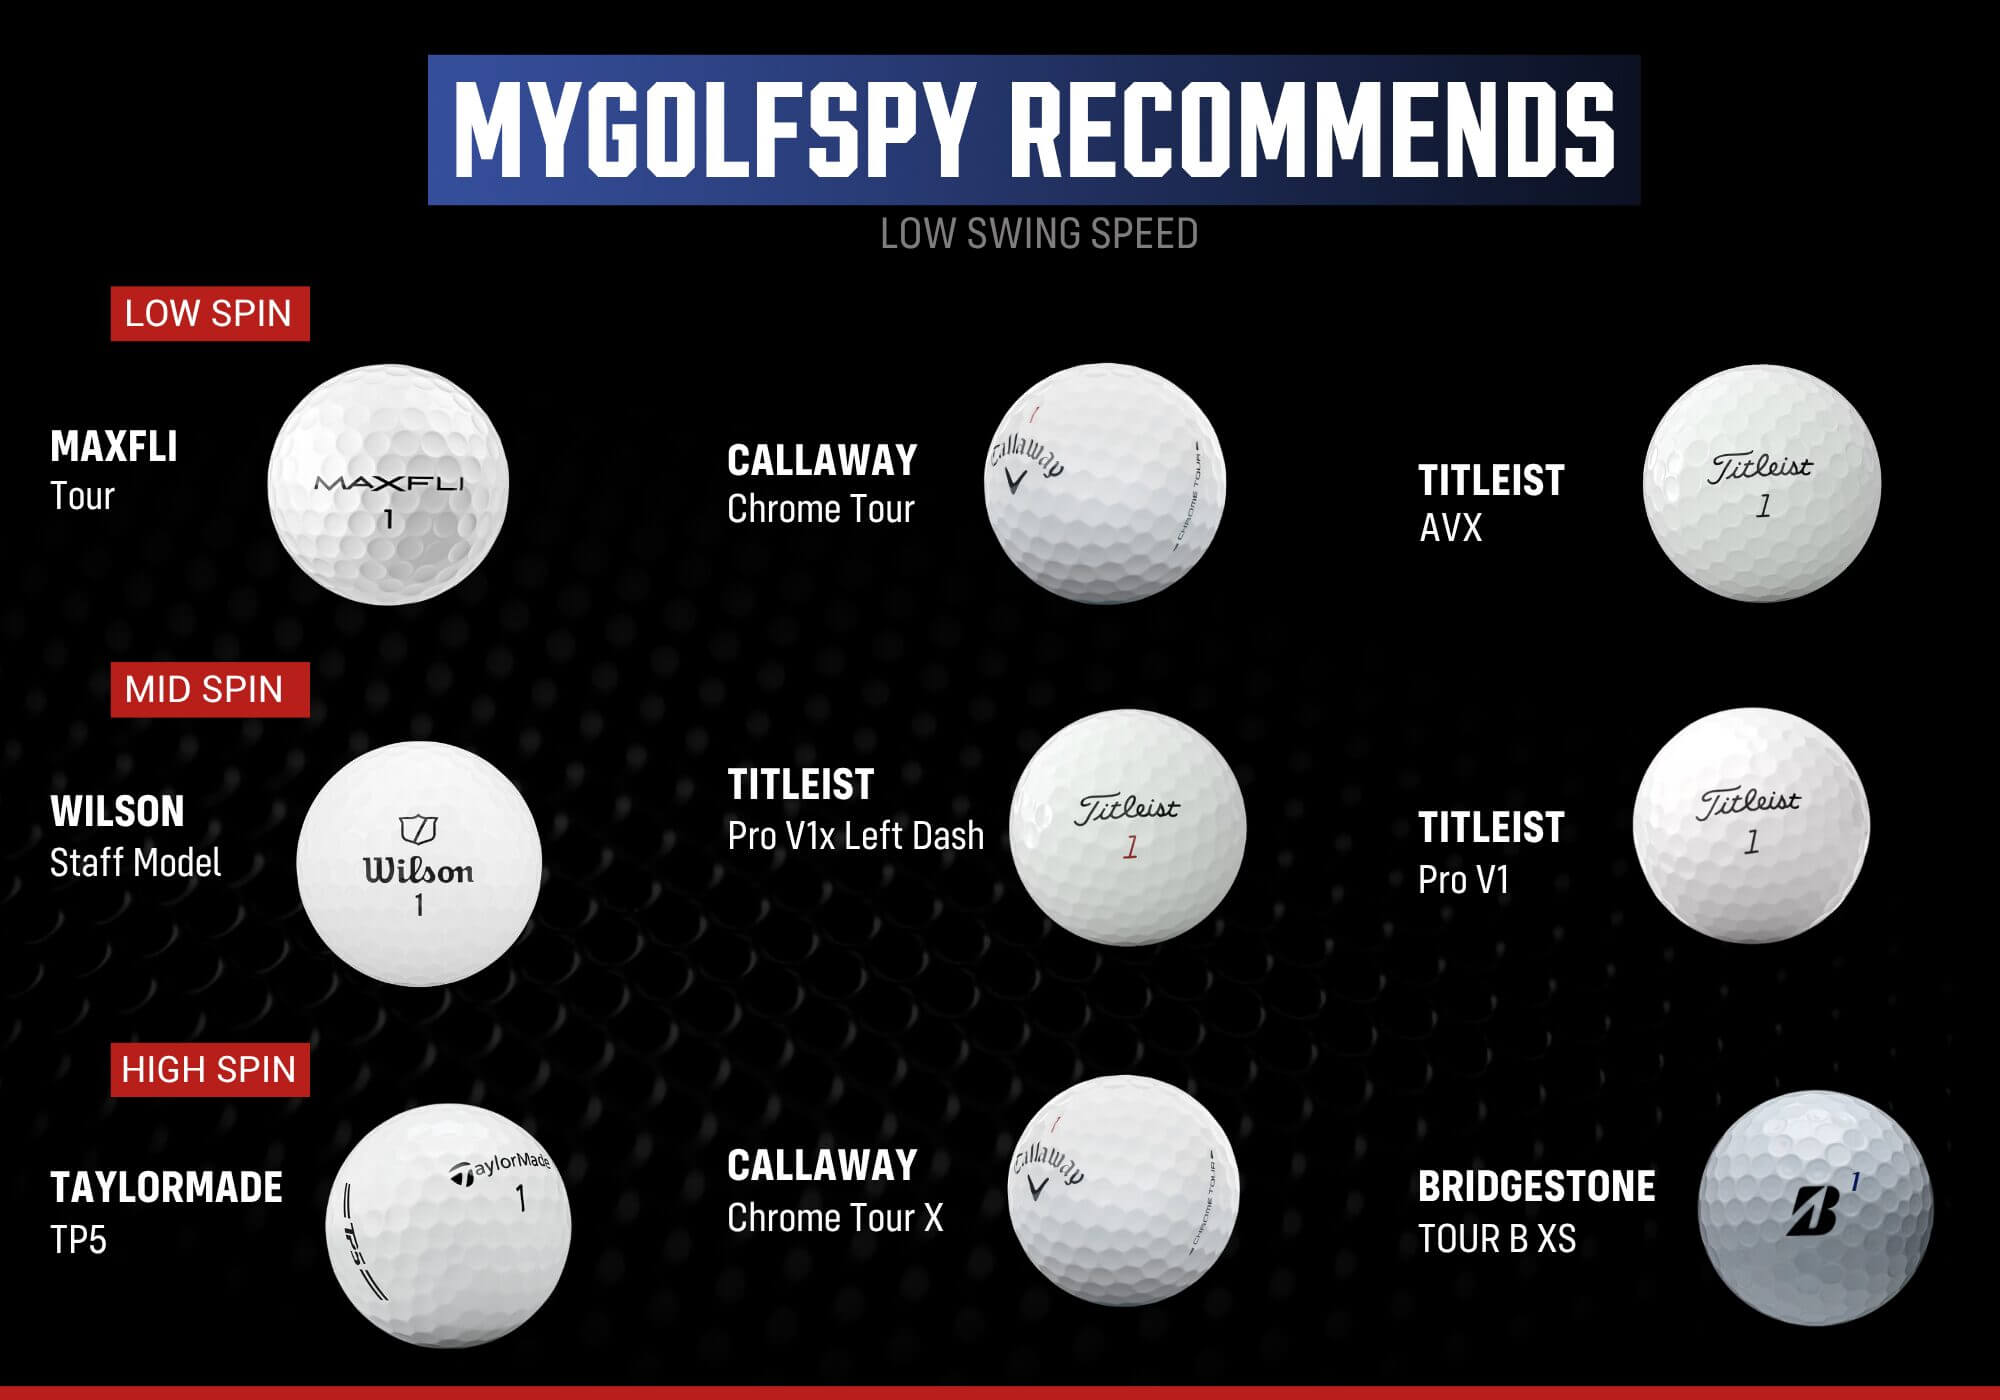
Low Spin – Maxfli Tour, Callaway Chrome Tour, Titleist AVX
Mid Spin – Wilson Staff Model, Titleist Pro V1x Left Dash, Titleist Pro V1
High Spin – TaylorMade TP5, Callaway Chrome Tour X, Bridgestone TOUR B XS
Great Buy – Maxfli Tour S
Ionomer – Amazon Basics
| Test Parameter | Test Median (All Balls) |
|---|---|
| Club Used: PXG Black Ops | Ball Speed: 125.1 |
| Swing Speed: 86 | Total Distance: 229.7 |
| Calibration Launch Target: 13 | Launch Angle: 12.9 |
| Calibration Spin Target: 3000 | Spin: 3092 |
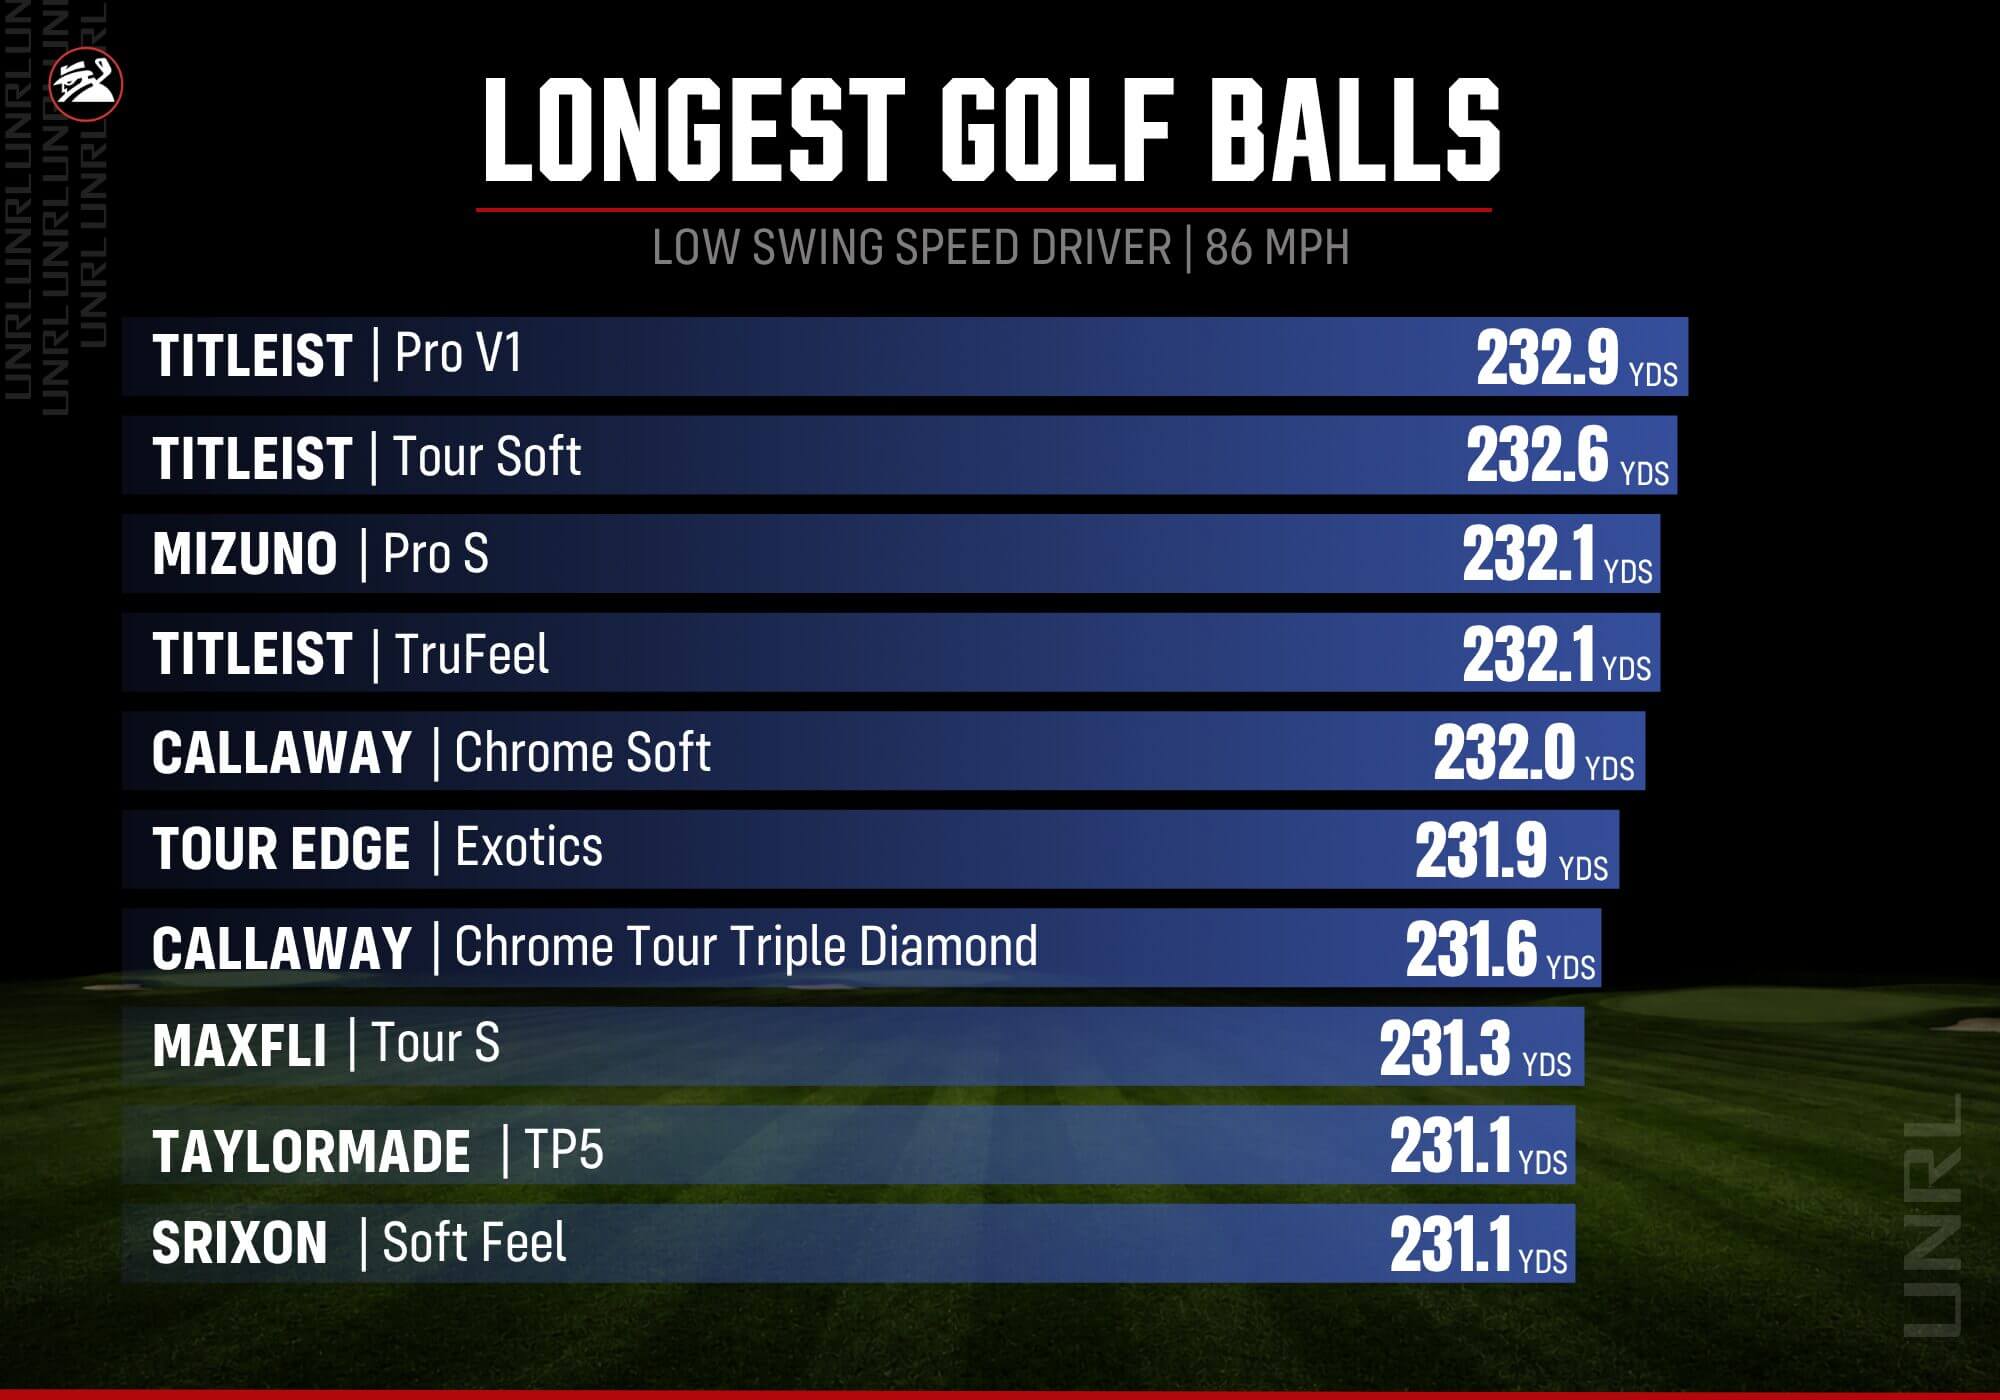
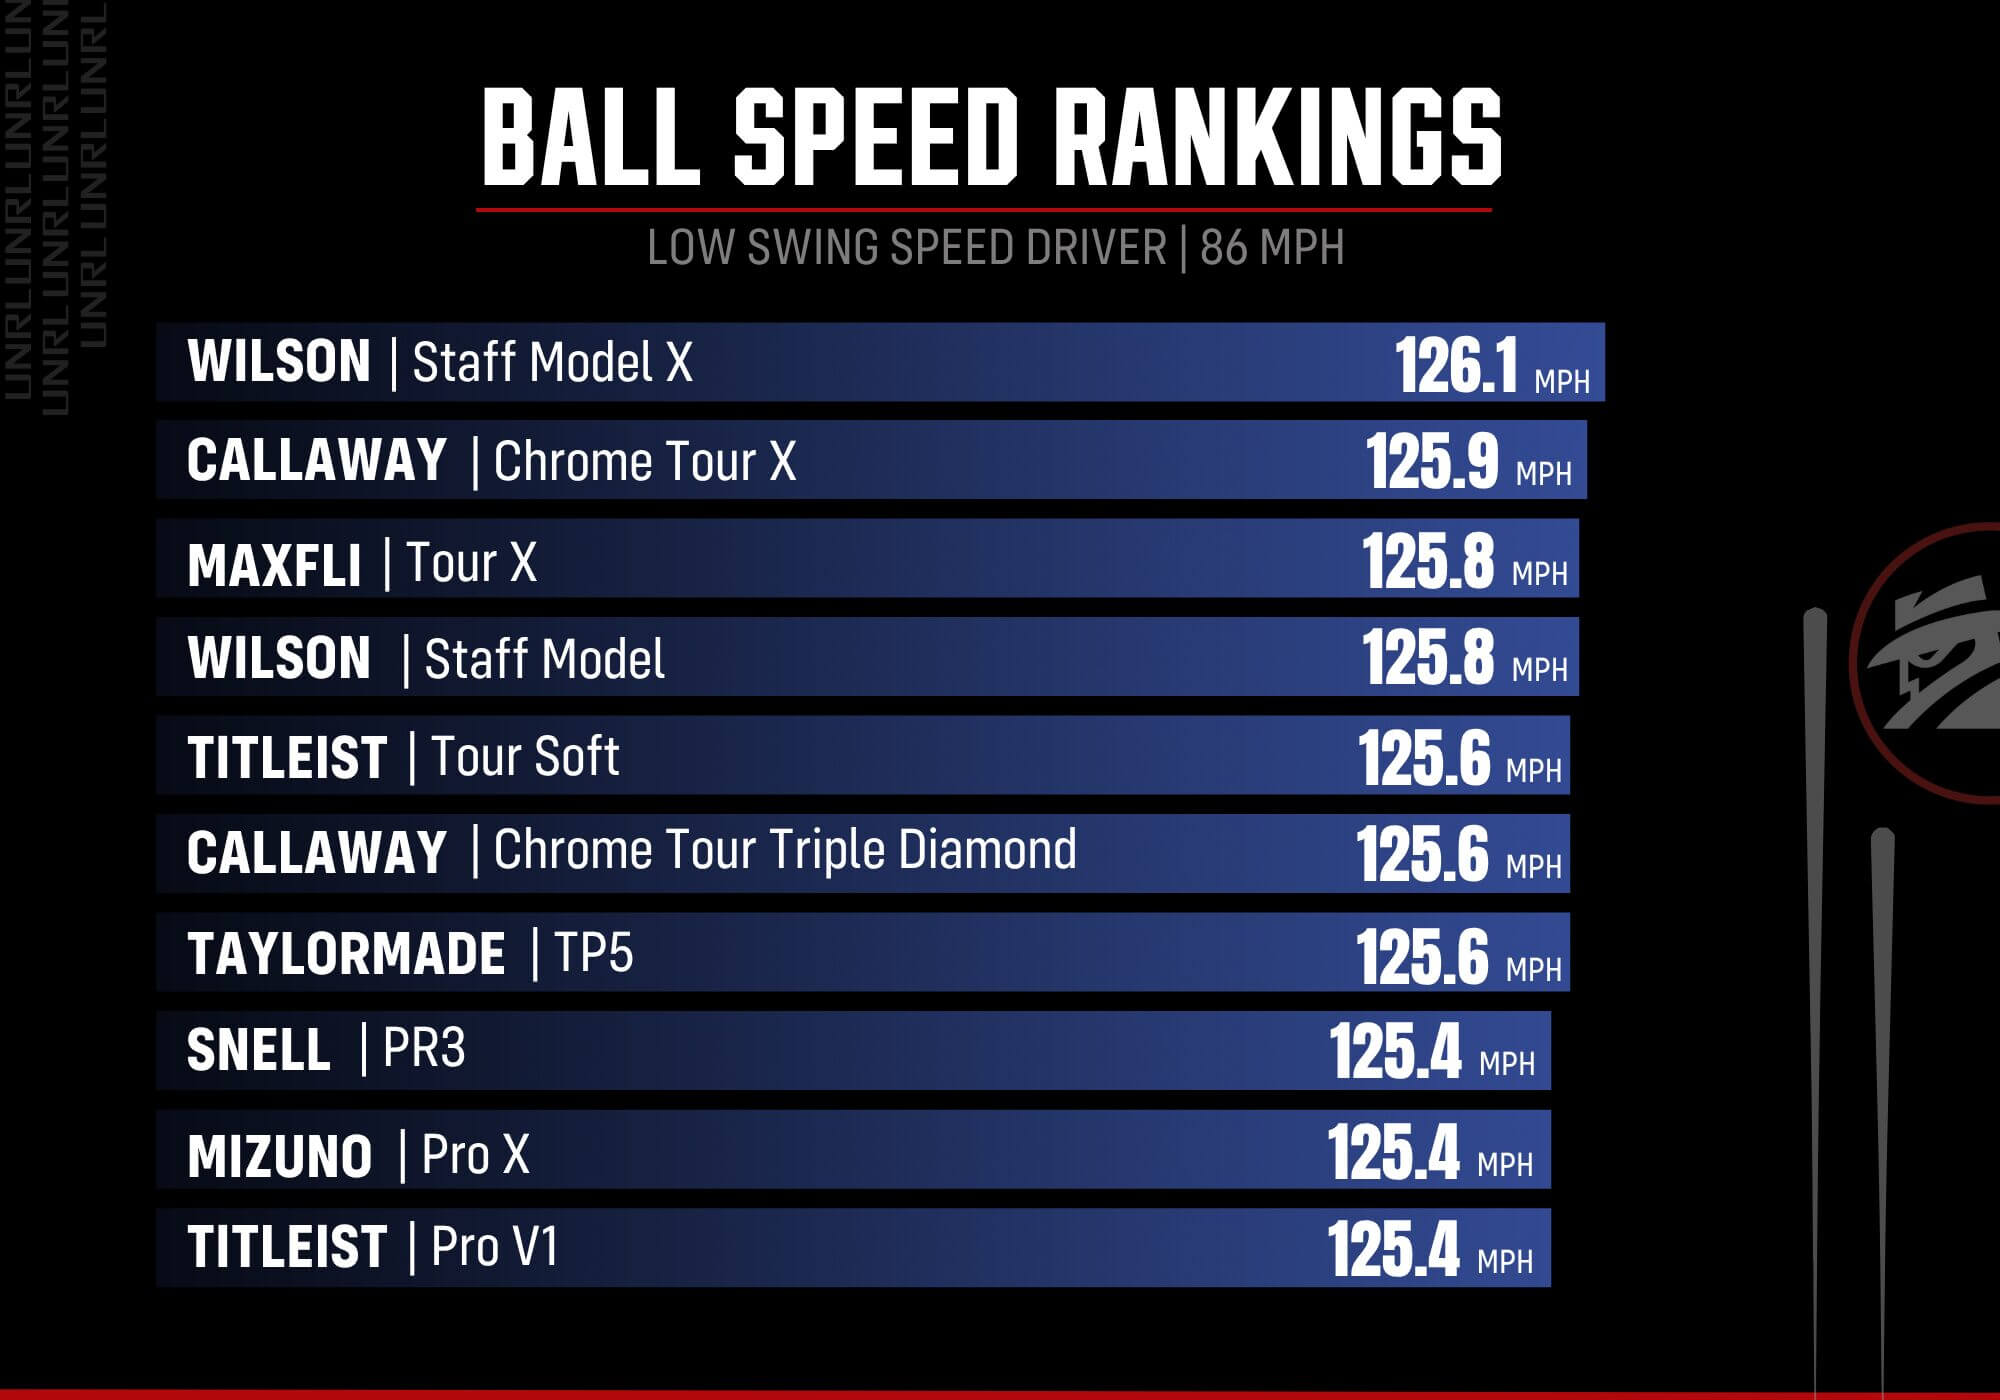
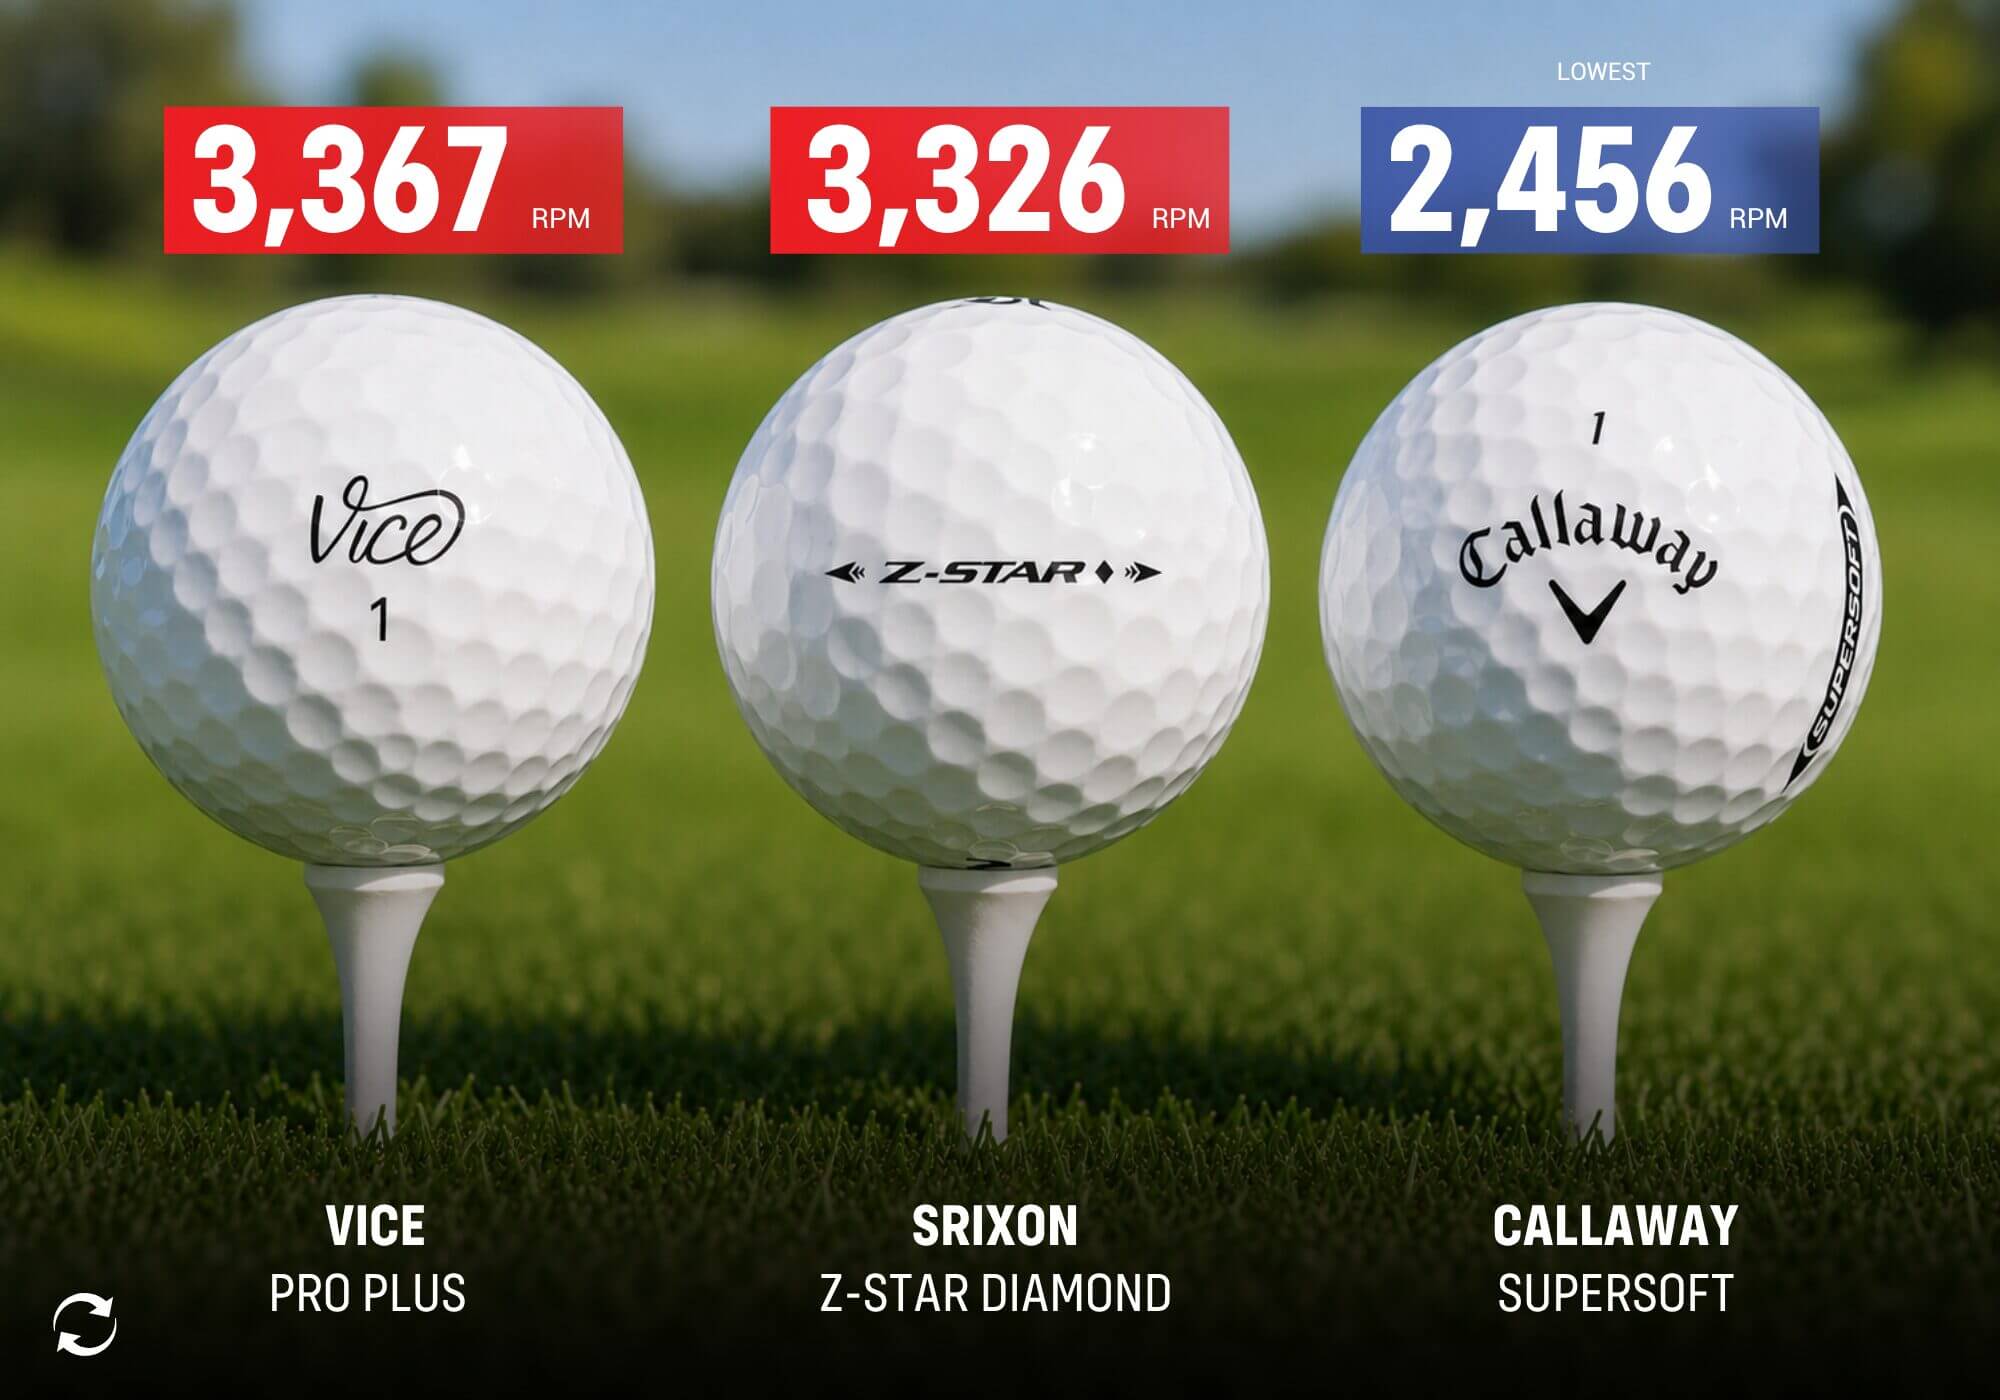
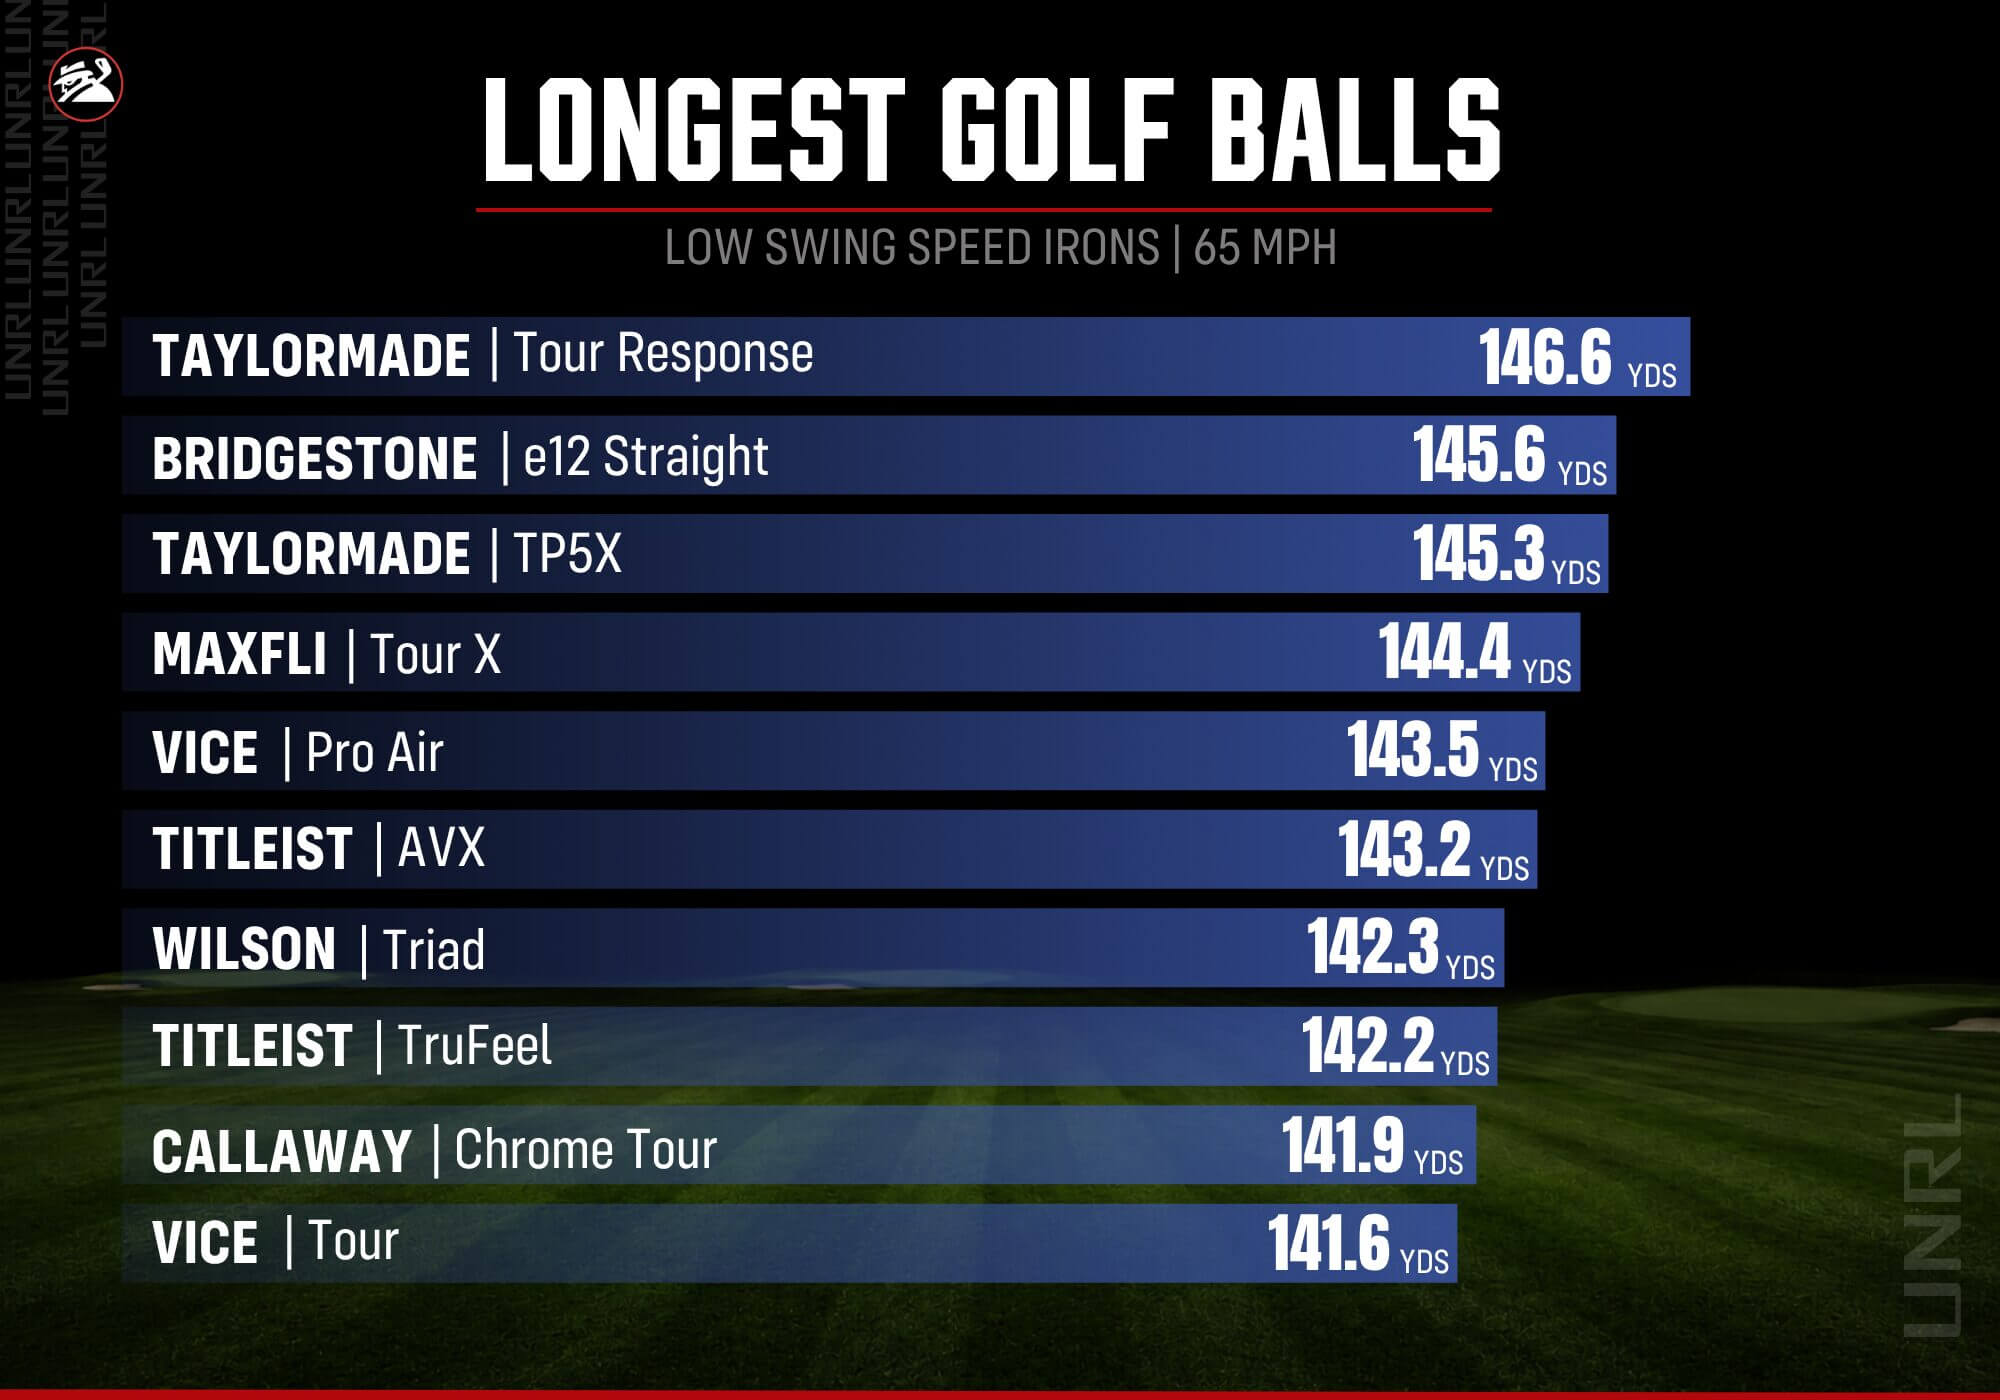
| Test Parameter | Test Average (All Balls) |
|---|---|
| Club Used: Titleist T100 | Ball Speed: 93 |
| Swing Speed: 65 | Carry Distance: 125.4 |
| Calibration Launch Target: 20 | Launch Angle: 20.3 |
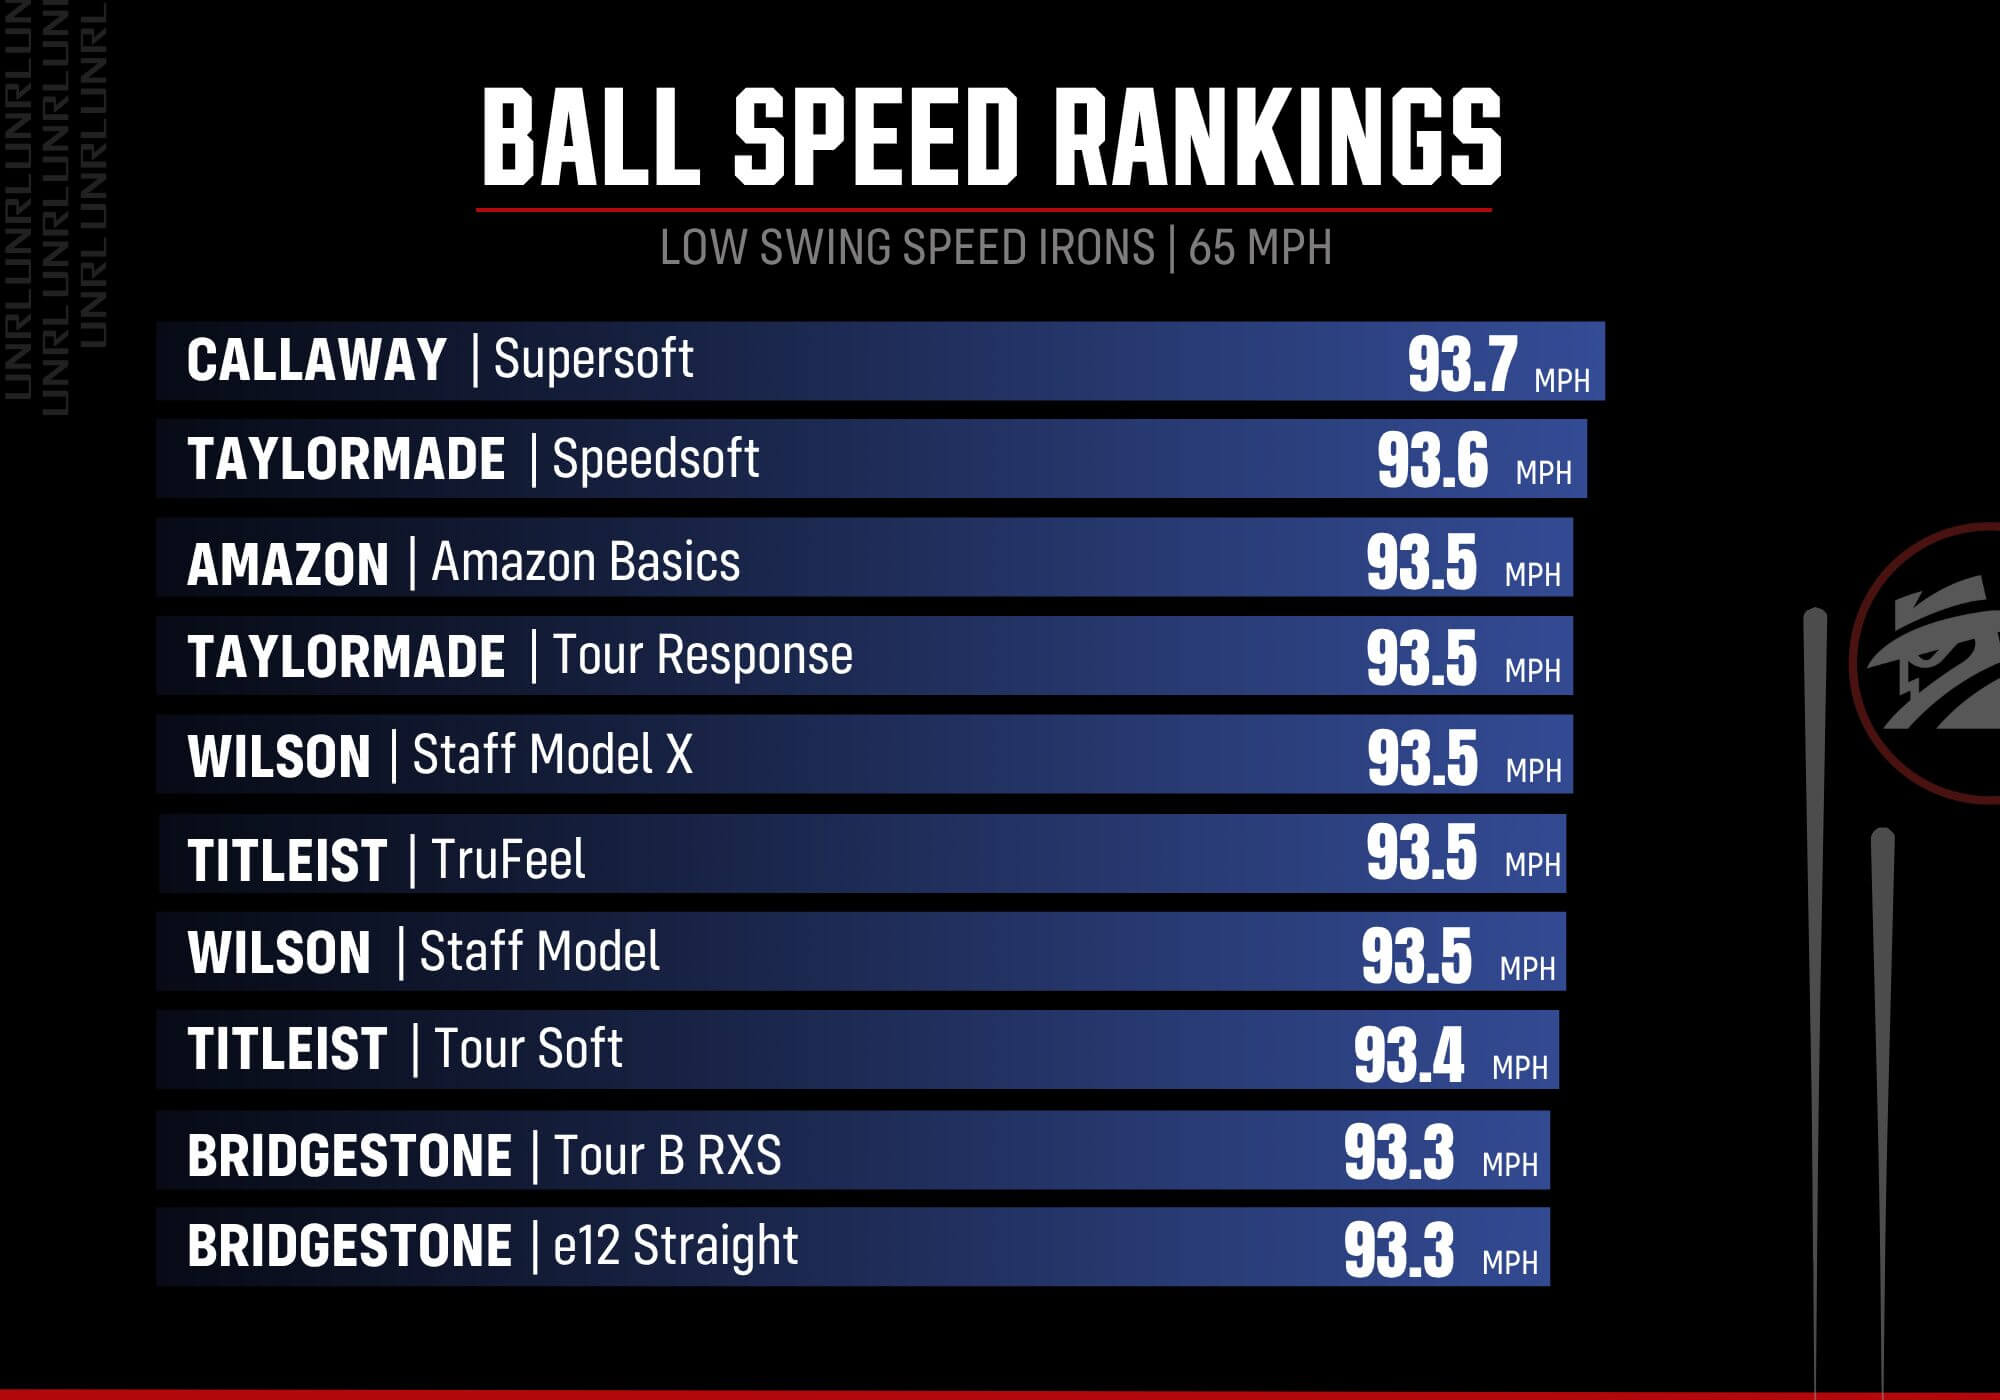
| Calibration Spin Target: 5000 | Spin: 4981 |
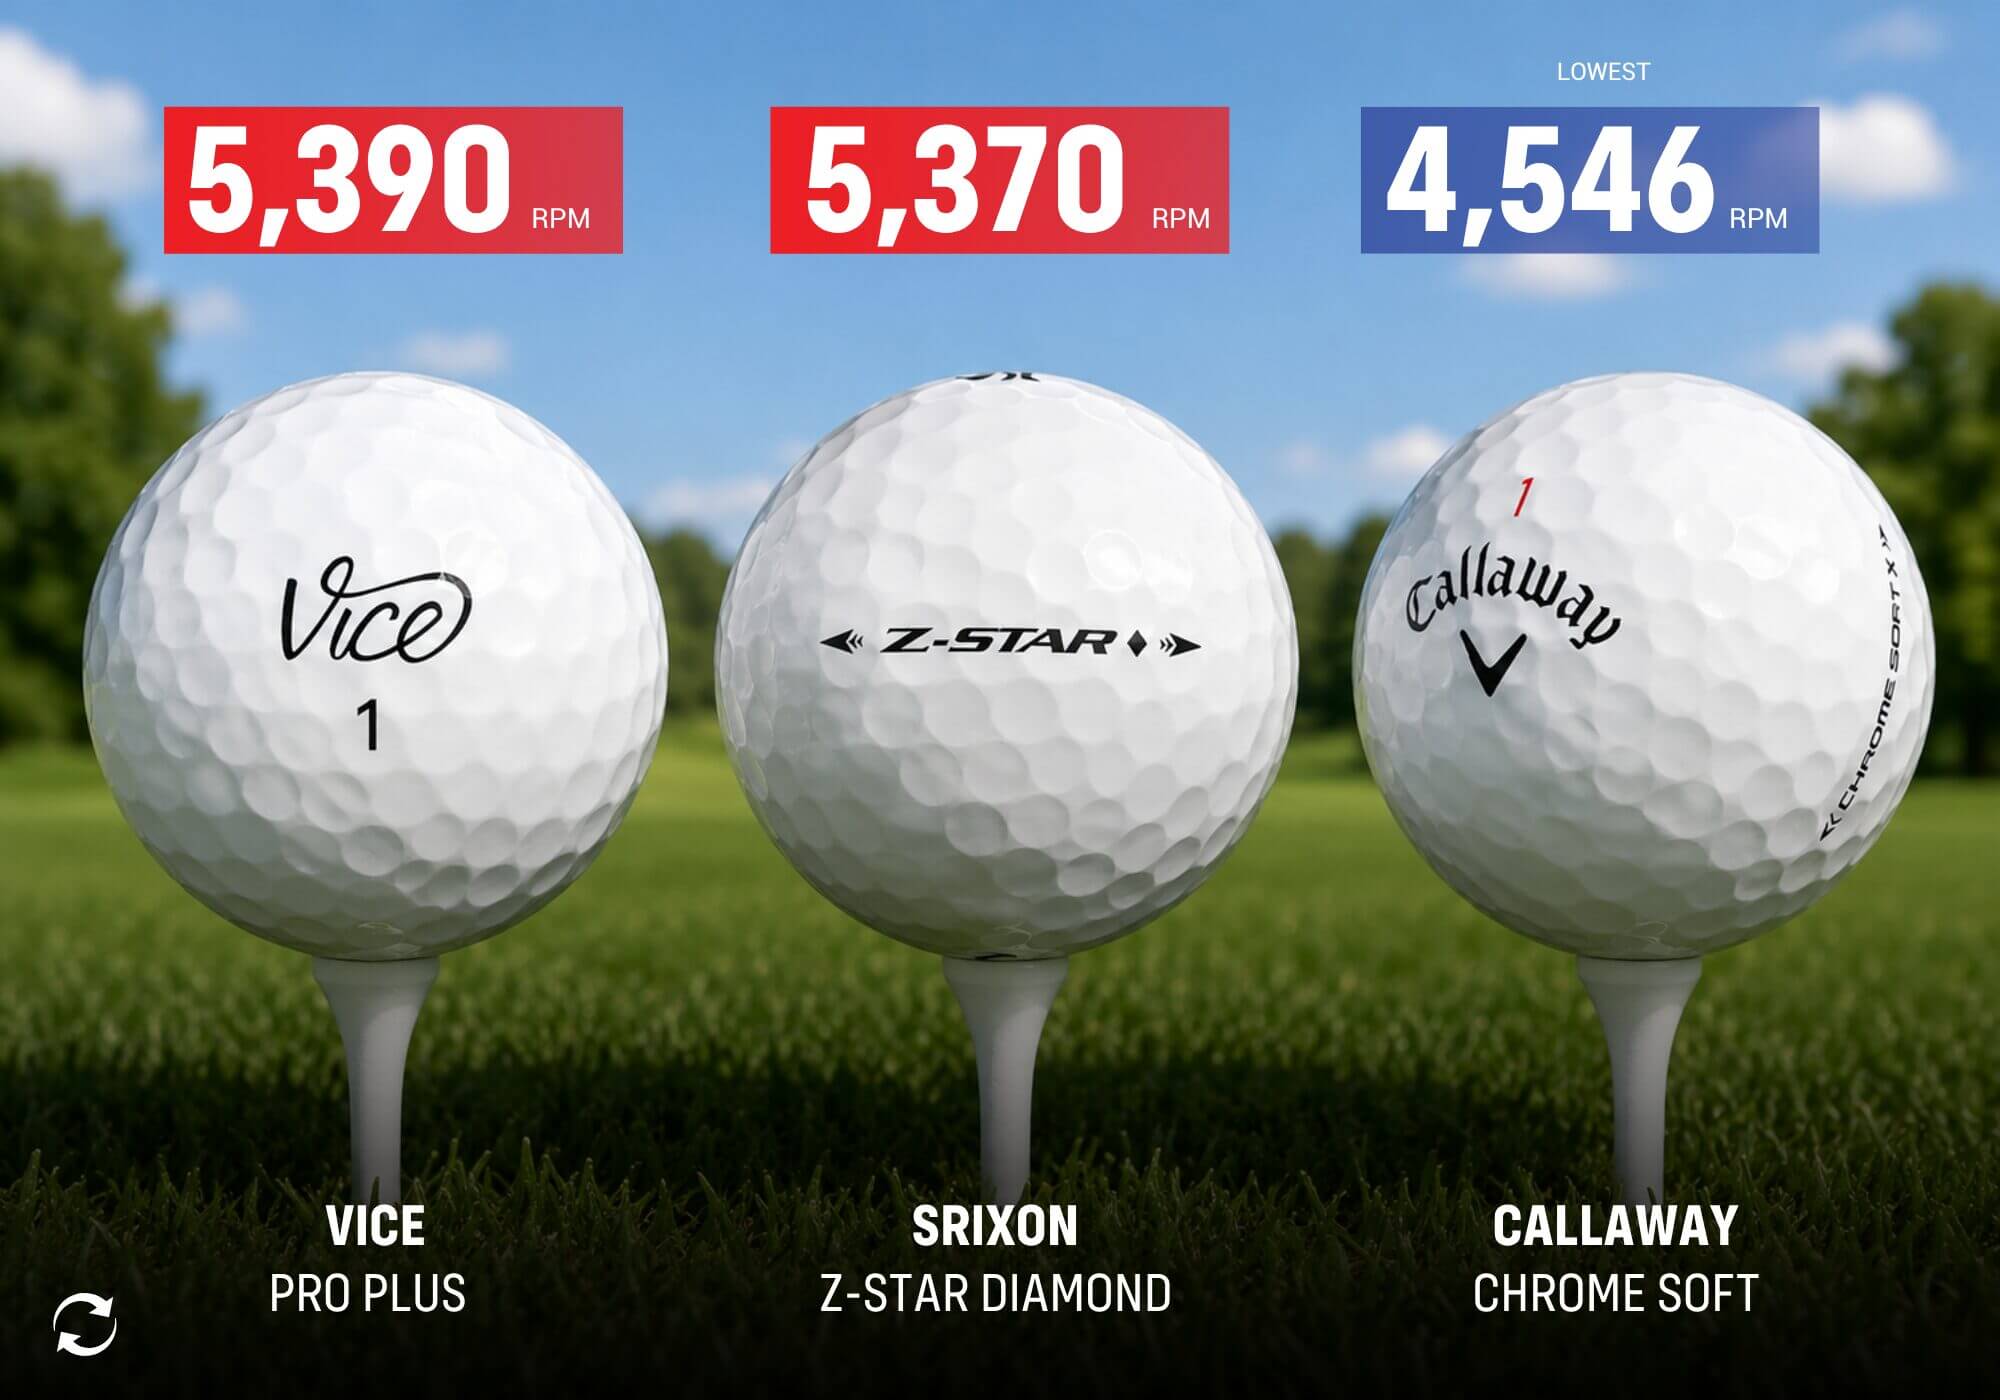
The wedge portion of the test was designed to replicate a greenside shot of 35 yards. Rather than calibrate to specific launch and spin targets, we configured the robot to hit the calibration ball approximately 35 yards.
| Test Parameter | Test Median (All Balls) |
|---|---|
| Club Used: Vokey SM10 | Ball Speed: 42.7 |
| Swing Speed: 42 | Carry Distance: 35.1 |
| Calibration Launch Target: n/a | Launch Angle: 32.2 |
| Calibration Spin Target: n/a | Spin: 5390 |
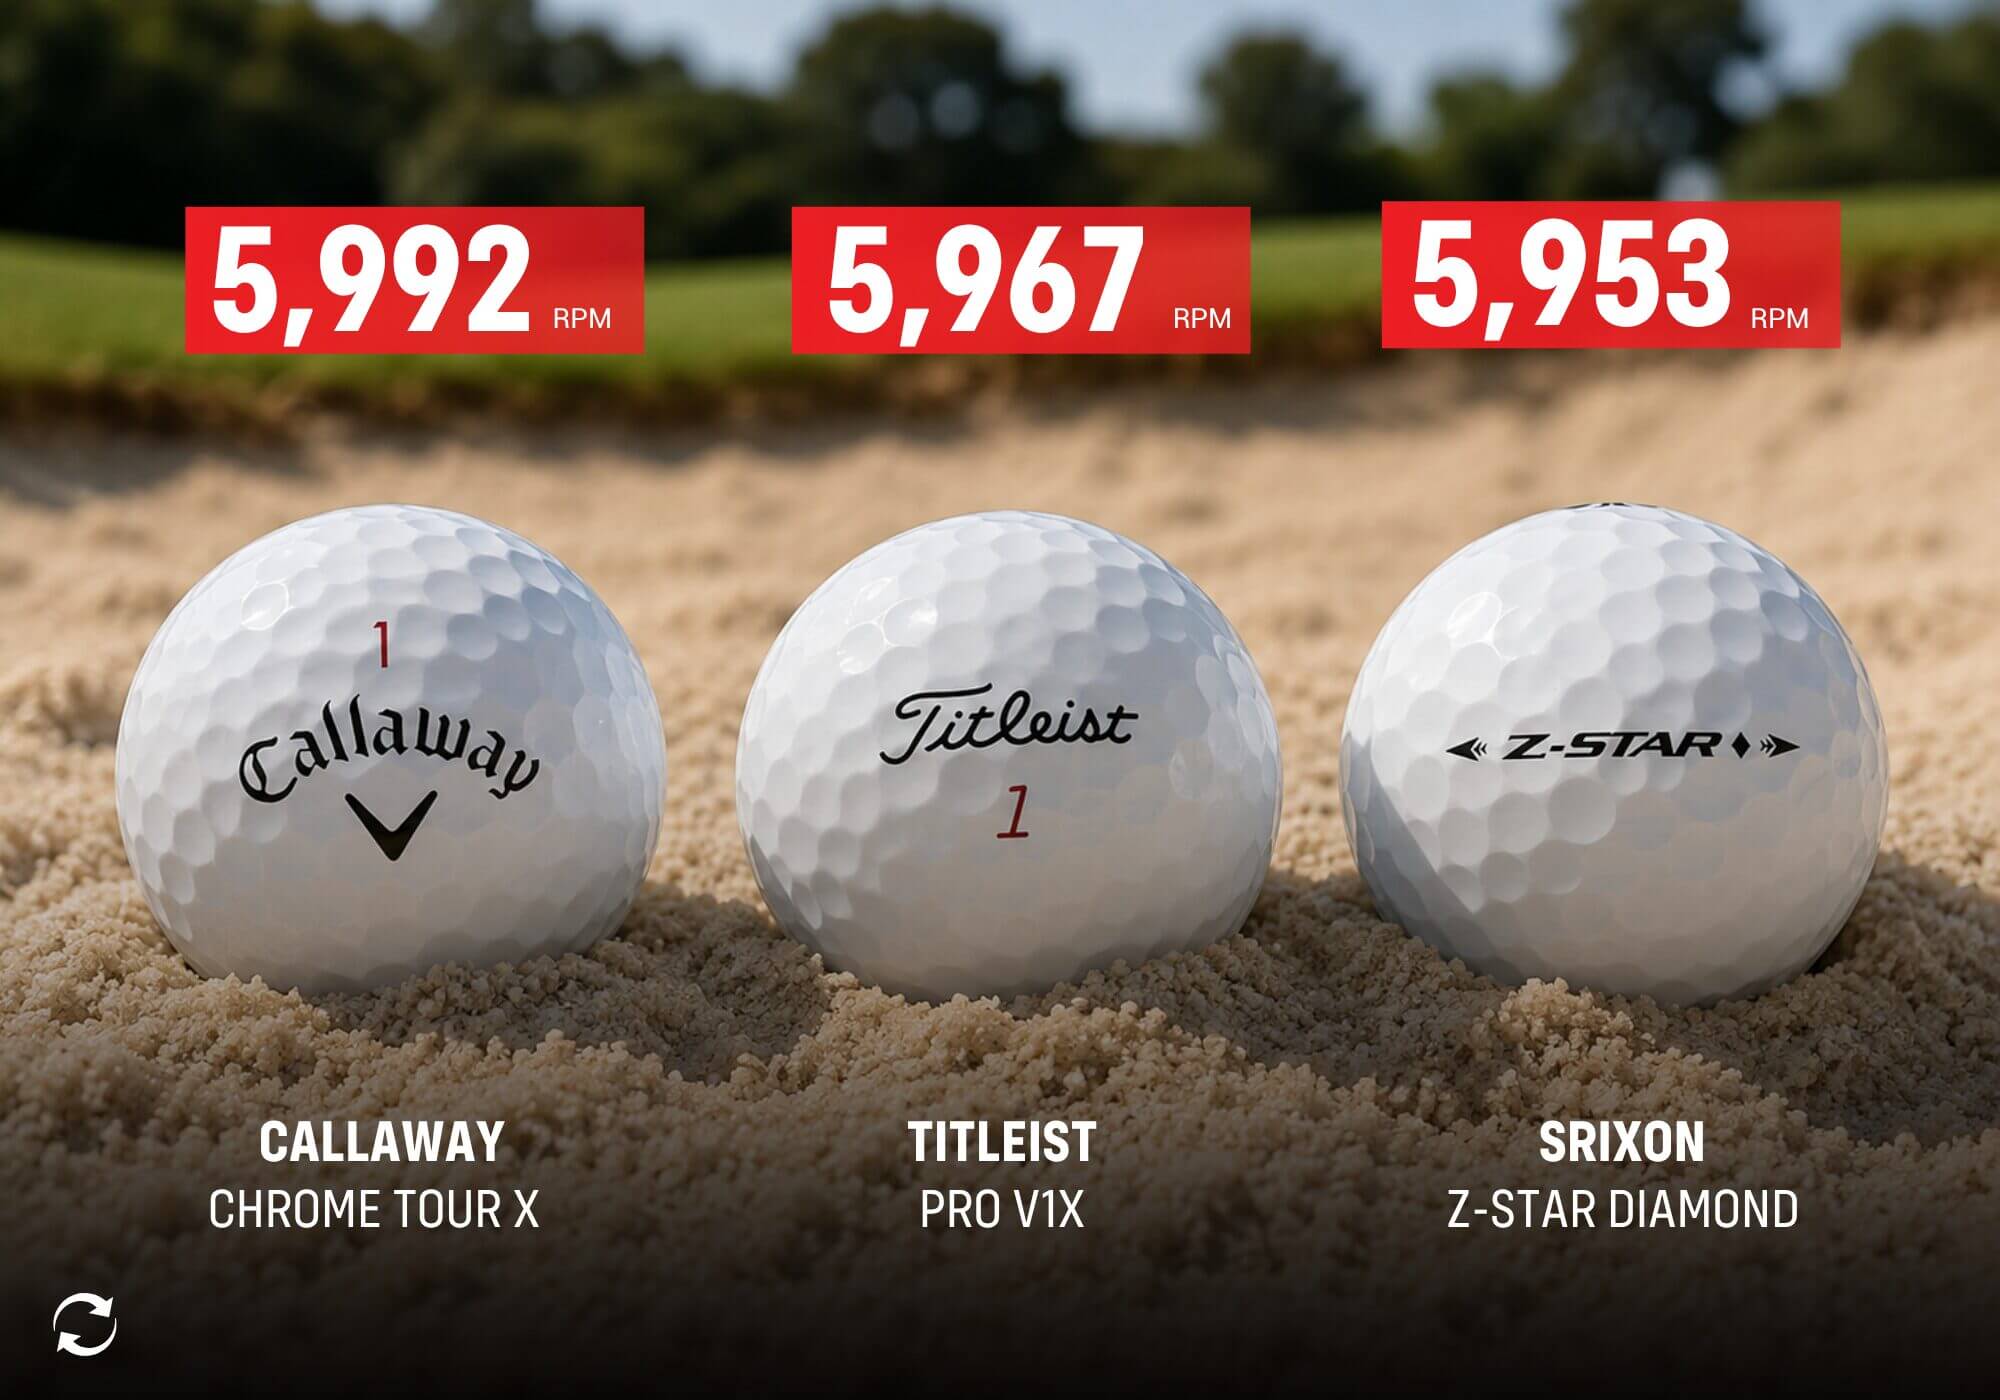
Launch angle may not be something you’ve considered on shorter greenside shots but we do see significant differences.
Our new dashboard contains the full data set from our 2026 robot ball test. It’s considerably more than we’ve published before and it’s intended to be explored rather than read straight through.
One thing to know before you start. Most of what you see is control-relative: every ball is measured against a control ball hit throughout the test. This provides us with a consistent baseline. Where it’s useful, we also offer other reference points against the field as a whole or against the specific balls in the same group a given ball was tested alongside. That group comparison is the most meaningful one we can make. Those balls were hit in the same conditions, minutes apart.
To help you navigate, we included overviews and explaners on every page. We’ve done what we can to make the data readable on mobile but for the best experience, you’re going to want to view on a desktop. If you’d prefer to break out of the embedded window, you can view the full dashboard here.
With that said. Explore. Have fun.
This is the first of several posts to come from the MyGolfSpy 2026 Ball Test. In the near future, you can expect reports on wet versus dry performance off wedges (yes, moisture makes a huge difference), refurbished and used versus old, as well as a test of how some of Vice’s more creative paint designs impact performance.
Stay tuned.
A: We’ve covered this before. The short answer? There isn’t one. As with your golf clubs, the most important characteristics are flight (a combination of launch angle, peak height and descent angle) and spin rates.
While there are some absolutes (softer balls are slower off the driver and invariably lower spinning), it’s ultimately the combination of flight, spin and speed that needs to be optimized for your game. It’s these levers combined with speed (compression) that will determine the best ball for how you deliver the club.
While many believe high compression is for fast swingers and low compression is for slower ones, the truth is that some high-speed golfers can benefit from the low-spin properties of low-compression balls while some slow-swinging golfers (many, in fact) will benefit from the higher trajectory and added spin offered by some higher-compression offerings.
A: Handicap isn’t an evaluation of your swing properties. It’s a measure of your ability and consistency. Just as with low-handicap golfers, higher handicaps come in all swing types so the same fitting rules apply.
Conventional wisdom holds that golfers fighting a slice or a hook may want to consider a ball that offers low driver spin. Low-spinning balls should fly a bit straighter off the tee. All else being equal, that’s solid advice, but we’ve found that ionomer balls are often less consistent than top-tier urethane offerings. It’s a detail that can quickly erase the on-paper accuracy advantage of low-spin models.
One other consideration is that many balls with true low-spin properties off the driver are also low-spin off irons and often low-spin as you move closer to the green. That may impede your ability to control the ball and hold greens on shorter shots.
Cost is also a factor. If you’re losing more than a couple of balls a round, spending $50-plus on a dozen balls likely doesn’t make sense. While used balls are an option, we highly recommend avoiding refurbished.
A: It’s a fact that golf balls fly farther when it’s hot as it was during our test. Carry and total distance numbers will be longer than in cooler conditions. What’s important isn’t the final number but rather the relative performance differences between balls. Those relationships should be minimally impacted by environmental conditions.
A: Finding the right ball is a process. Our recommendation is to start with a few you think might work. If you’ve got a launch monitor, use it to trim the list. If you don’t have access to a launch monitor, our data should help you narrow the field. Test on the course and side by side. For the best comparison, don’t test more than two balls at a time.
The conventional wisdom is to start around the green and work backward. The idea is to see how the ball performs on relatively short shots (partial wedges). From there, move to your irons. That’s where the biggest differences are and where you’re most likely to notice them.
Chances are you have an adjustable driver so once you’ve found the ball that performs best through the rest of the bag, take advantage of the driver’s adjustability and tune it to fit the ball.
A: For the swing speed closest to yours, the ball speed, launch and spin relationships between balls should translate reasonably well. The fastest balls will be fast. The “spinny-est” balls will still be spinny. How those factors come together in the total distance equation heavily depends on other factors in your swing (attack angle, loft, impact). Realistically, the more your launch and spin characteristics diverge from our baseline, the less reliable the distance numbers will be for you personally.
A: For the most part, yes. While balls played on the PGA Tour often pass additional checks to ensure they’re conforming, nobody is sitting on a secret stash of high-performance Tour-only balls. Ball manufacturers want their Tour staff playing the retail ball and that’s mostly what happens.
That said, nearly every manufacturer has a couple of secret menu offerings. These are typical niche balls (very low or very high spin offerings, for example) that won’t be a good fit for most golfers.
It’s also true that some Tour pros play prior-generation balls that were once the stock retail ball but have been superseded by newer models.
A: MyGolfSpy purchased all of the balls used in this test at retail from multiple vendors.
A: For this year’s test, we leverage Trackman’s native bounce and roll algorithm. Every indication is that it’s built off PGA Tour (or similar) conditions. That is to say firm and fast with an emphasis on roll. It is what it is but we’d suggest cross-referencing total distance numbers with carry values for a more complete picture of distance.
While the distance should be relative regardless, you may want to focus on carry yards, particularly for irons and wedges.
A: Golfers have been trained to think in terms of launch angle but, when it comes to the golf ball, launch angles tend to be very similar and it’s not uncommon, for example, for a ball with a low initial launch angle to have a comparatively high peak height.
When we discuss trajectory, we’re primarily looking at the max height number as it indicates which balls flew the highest. Those small differences in launch angle, along with descent angle and max height distance (how far down-range the ball reached its apex), can help paint a more complete picture of a ball’s trajectory.
You’ll find a more complete picture of each ball’s trajectory under each of our test conditions in the tool above.
A: First, most manufacturers have released new models since our previous test, so we would expect performance differences.
Second, as we have in the past, we have made a few modifications to the test setup that we hope improve the overall quality of the test. Those changes invariably contribute to different outcomes, especially as it relates to carry and total yards.
It’s also true that manufacturing variance can also influence year-over-year results.
A: Not a question and also false. We know golfers want to see distance numbers but the test parameters were meant to reflect the real-world averages for each swing speed. Simply put: we didn’t optimize for distance; we configured the robot to meet launch and spin targets consistent with those of average golfers in each group.
While distance is not unimportant, we want to emphasize that the right ball for your game is the one that is optimized for the trajectory and spin properties created by your swing.
A: Selecting a control ball is an interesting challenge. We wanted something we know to be consistent but also not a ball that’s in the test.
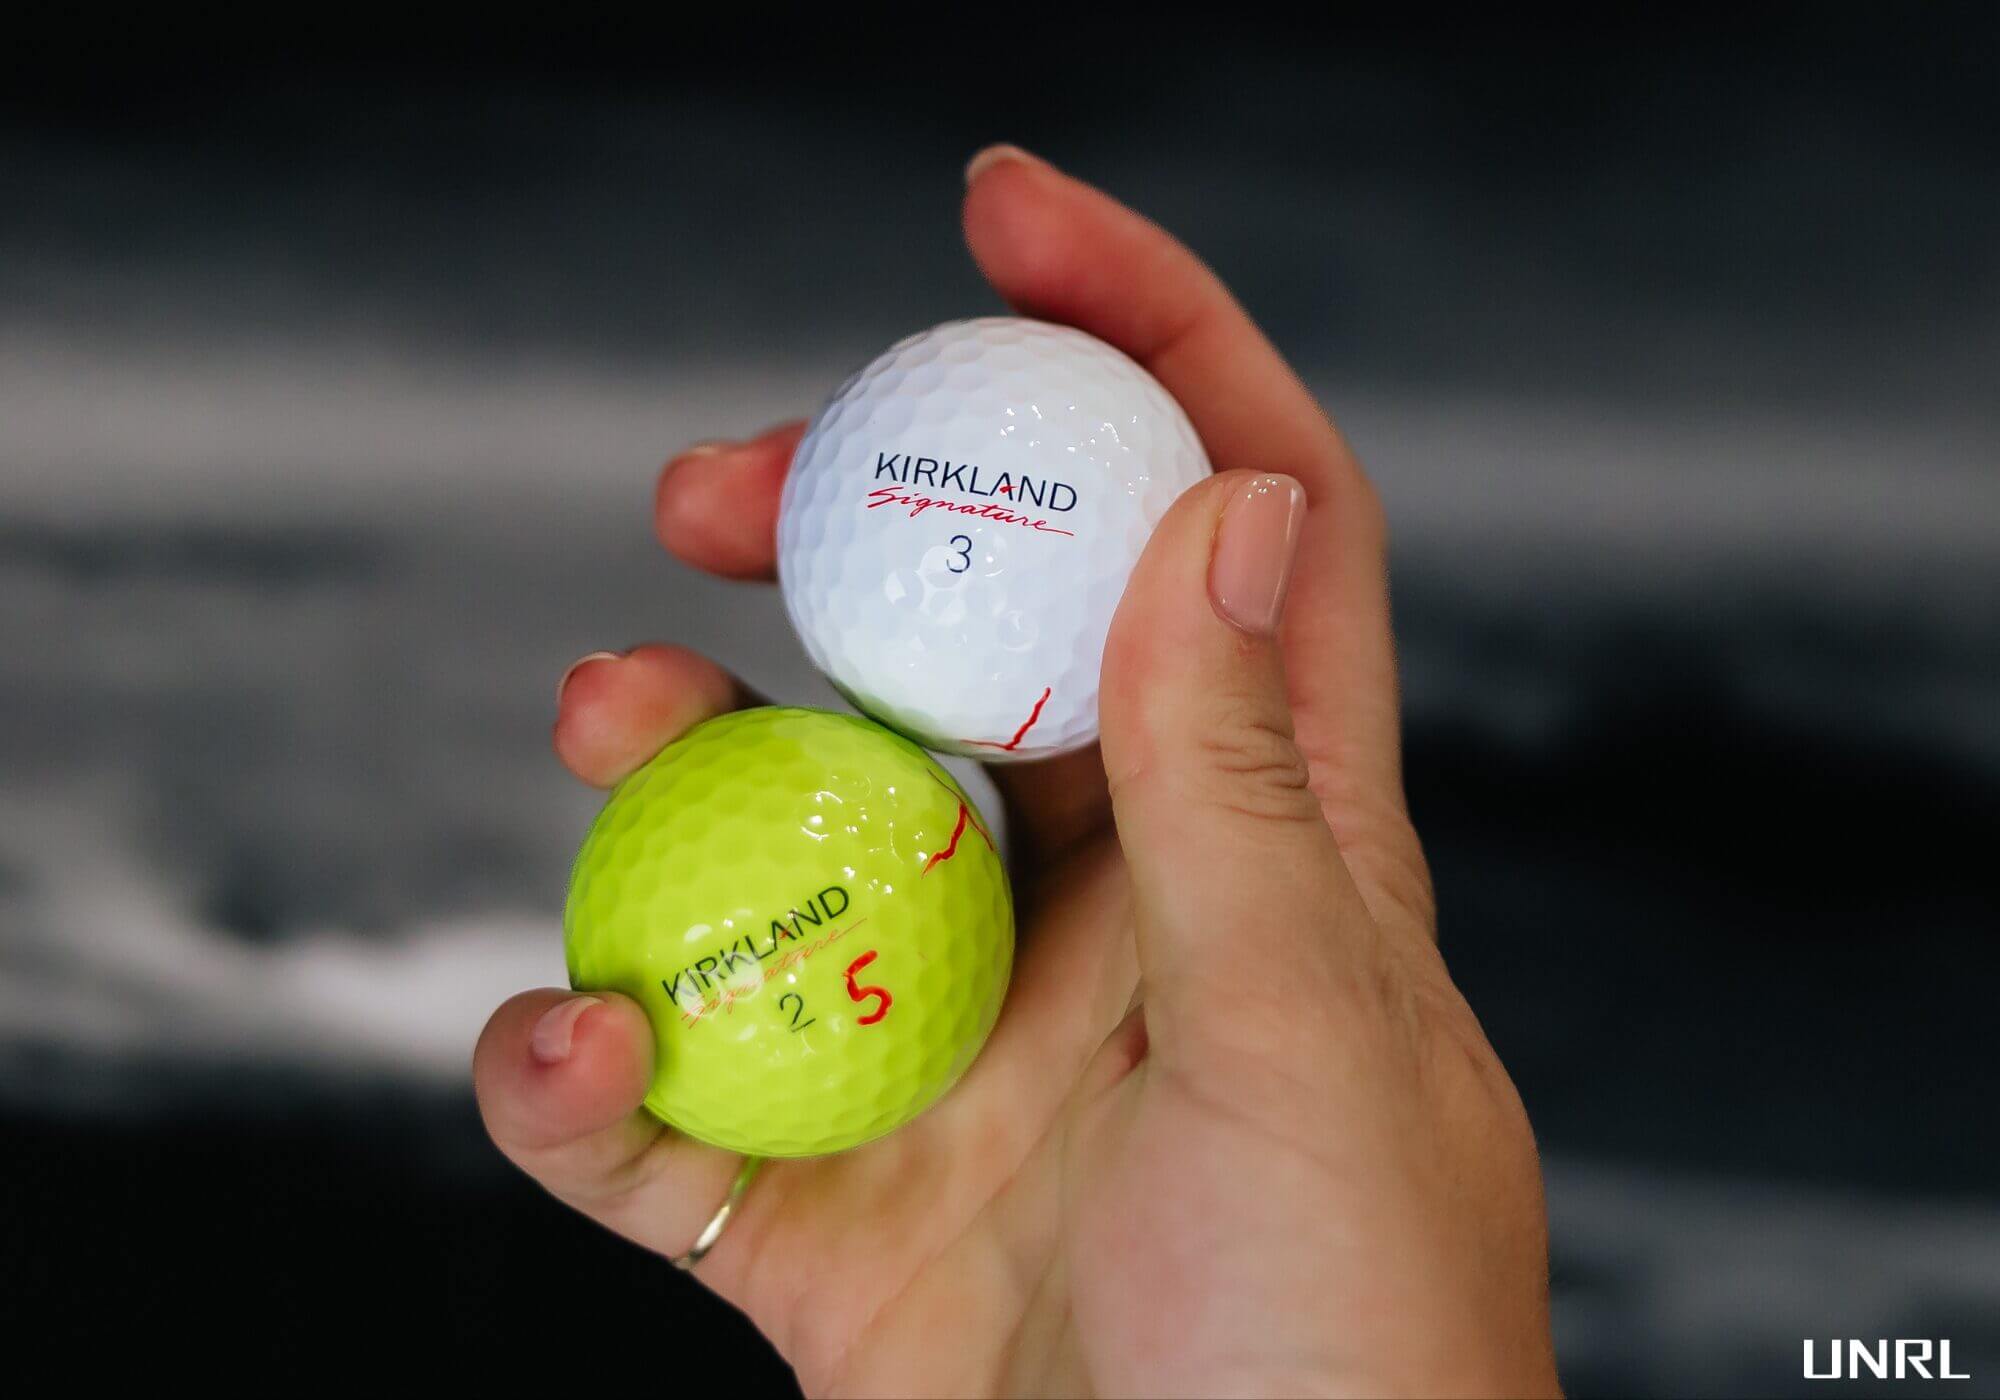
While differences between the yellow and white versions of the Pro V1 are small and often statistically insignificant, it provides a reliable option with middle-of-the-market performance characteristics from a ball that isn’t otherwise in the test.
A: As readers have noted, the yellow and white versions of the ball are produced in different factories. That alone doesn’t guarantee performance differences but enough of you have suggested that real differences exist that we wanted to look into it further.
The data tells a compelling story and we’ll have a deeper dive on this in the coming weeks.
A: Ball Test capacity is always limited so we can’t test everything. The inclusion of more low-cost/ionomer models limited the number of urethane offerings we could include. Testing the most popular options on the market is not optional. To round out the field, we asked our readers what we should include. The balls we tested reflect what our users chose.
Our hope is to include more brands and more models in the future.

World-class testing requires world-class equipment. This is the gear we trust to help us fulfill our Most Wanted testing.

Tony is the Editor of MyGolfSpy where his job is to bring fresh and innovative content to the site. In addition to his editorial responsibilities, he was instrumental in developing MyGolfSpy's data-driven testing methodologies and continues to sift through our data to find the insights that can help improve your game. Tony believes that golfers deserve to know what's real and what's not, and that means MyGolfSpy's equipment coverage must extend beyond the so-called facts as dictated by the same companies that created them. Most of all Tony believes in performance over hype and #PowerToThePlayer.


| Driver Titleist GT3 9° | Mini Driver TaylorMade R7 Quad 13° |
| 4-Wood Titleist GT2 16.5° | 4-Hybrid Titleist GT3 |
| Irons (5-PW) Titleist T350 | Wedges Vokey SM10 (48° F, 54° F, 58° T) |
| L.A.B. Golf DF3 | Ball Titleist Pro V1x Left Dash |
4 weeks ago
Any chance of seeing complete lists and not just the top 10.
1 month ago
During these tests, I would be good to know which balls showed consistency of results from ball to ball. In other words, how consistent was each ball for the parameters recorded. Which ball showed the most consistent results? Which balls were above average consistent? Which balls were below average consistent?
2 months ago
LOVE your test each year, thank you!! Quick question on MID Speed Top 3. I have found Cally Chrome Tour X a great combo of distance and spin, hence its my gamer. Looking at your results, seems it should be in top 3 as it seems as good and even better than prov1x & vicepro+? Just curious what kept it out, was it inconsistant or something? Diamond version did just as well it appears?
2 months ago
I was very impressed with the board and all the testing procedures in place. However, very disappointed that the Erc soft and Bridgestone e12 speed were left off??? Obviously you cant cover every ball but these are staples.
2 months ago
Great work! I especially love the dashboard. I wonder how these results would correlate/coordinate with the Ping Ballnamic models. I’d like to have the ability to plot the sum distance within a given speed range or maybe sum distance vs iron descent angle. In other words, what would be the longest ball tee to green with at least 45 degrees of descent? Of course the results might not apply across everyone’s launch conditions (in fact they probably don’t).
Such interesting data.
2 months ago
“ Testing the most popular options on the market is not optional.”
So no AD333.
2 months ago
Hi Mike,
Welcome to the world of Srixon. The AD333 is sold in the UK and Europe. In the rest of the world, the ball is sold as Q-Star. It’s the same ball. Hope it helps.
2 months ago
Is there a way to see the results for all the balls tested at each speed as opposed to just the highest rankings?
2 months ago
yeah, look at the table right above the comments.
2 months ago
Where can I find the ratings of each golf ball? Like the Pro V is a 98 or the TP5 is a 95 rating? That helps me out the most and how I used that number compared to the data accumulated by the test. Its how I best help my team, high school golfers, choose the best ball for them. A lot of times its a mid to upper-mid tier rating that works best for them; especially the ladies.
2 months ago
Anecdotally, I can back up the data on the Maxfli Tour X at mid swing speeds.
About a month ago I ran dry of my stash of ChromeSoft X LS and decided to give the Tour X a run, based on last years MGS test results. Im not sure what got changed in their formulation or manufacture from last year to this year – but there is a difference, especially off the irons.
Off the driver, there wasn’t much of a shift in performance to notice, most of my drives landed in the places Ive landed hundreds of times before. But thats when things changed. Hitting the same clubs Ive hit into the same greens from the same distance Ive dne time and again, I came up 5-8 yards short a number of times.
Seeing the data here makes me feel a bit better at least, as Im about to enter the final year of my 40s later this month, I was starting to worry.
Great stuff guys, thank you for doing this (even if this does look like the most fun you could possibly have while doing a TON of repetitive tasks and recording dats. Maybe thats just my kind of party)
2 months ago
I still have my stash of ChromeSoft X LS balls in yellow, trying to hang onto those as long as I can.
2 months ago
Great stuff. Trying to find data to leave Titleist, specifically Tour Soft. Old man 75 years old, driving distance correlates to swing speed. Everything I see, there is no reason to leave Tour Soft. Looking forward to wet and dry wedges. If Tour Soft puts me 10 yards closer does the additional spin of a more lofted wedge offset the loss of spin due to water? Also going to be hard pressed to leave Titleist quality behind.
2 months ago
Hi MGS staff,
Thank YOU for putting this data together, it is great! Is the Peak Height for Full Swing Wedge data in feet as labeled or is it actually yards? The balls all range from 25′-30′ which seems low for a full wedge.
Thanks again!
2 months ago
Amazon Basics is looking like the most accurate ball off the driver for Mid swing speeds!
2 months ago
What about left-right dispersion? What about length dispersion? Feels like you missed some important numbers in the presented data
2 months ago
Spray (left to right) and range (front to back) data can be found on both the individual ball model pages and the compare feature of the dashboard.
2 months ago
Unless I am reading it wrong, for mid swing recommendations, for low spin balls, you recommend Bridgestone Tour B RXS. That has more spin than the B RX so I am confused. Any help would be appreciated! Thank you!!
2 months ago
I’m a mid-swing player, no way I believe there is a 19 yard difference on a 7-iron between the Maxfli Tour X and Callaway Chrome Soft. I’ve played both balls and if this were the case, it would completely change the club selection based upon which ball I was hitting, and it just doesn’t. Maybe a few yards, but 19 yards? Come on, just not buying it based on actual play with these balls.
That data point alone makes me question the validity of the results. I always look forward to the results of the MGS Ball Test, but have to say I’m now VERY skeptical.
2 months ago
Agree. Very confused with the results. If I am not mistaken, the ‘26 Maxfli Tour X is unchanged vs ‘25. In the ‘25 test, the mid-iron carry was 147 and total was 155 at 80mph, above average. This year it’s 153/160 and dead last. Same T100 club. Only difference seems to be weather conditions and an additional test site.
2 months ago
As I mentioned in a previous comment. No two robot configurations are absolutely identical. There is always variation, and that impacts what happens downrange. Also, I feel like you gloss over the environmental stuff a bit too easily. The impact there is significant; I’d wager far more significant than most golfers consider. The only constant from one year to the next is the elevation. With irons … we were significantly cooler this year (which actually suggests shorter), but also more humid (increased carry), and the big one — almost no wind compared to a headwind last year.
And to reiterate again … we do not configure the robot to hit a distance number. Other than our 35-yard wedge test, it is not a factor in our configuration at all. We are trying to hit speed, launch and spin targets. PERIOD. It’s also worth pointing out that there are a variety of levers that can be pulled in how the robot is set up to achieve those numbers – amp/ramp settings, attack angle, path, impact location – it’s a lot and it’s difficult (maybe impossible) to 100% match from one day to the next.
I can’t say with certainty what people believe, but my sense from reading comments over the years is that those who have never been involved with it think that a robot test is basically plug-and-play. Turn it on, enter some configuration details, strap in a club, and you’re good to go. If only …
2 months ago
Appreciate the reply. I think you’ll have a lot of mid-speed readers long Tour X’s regretting buying in bulk. My OB prone children will appreciate the Maxfli upgrade.
2 months ago
Now look at last year’s iron results. High speed is about the same, but mid and low speed very different results, despite same T100 7 iron, location, swing speed. Last year was even hotter, so the balls should have gone less this year, not almost 20 yards more. Fishy fishy.
2 months ago
I appreciate the critical thinking; I really do, but continue the thought. Maybe go a little deeper than two numbers from two different tests not aligning, so this is fishy stuff.
Wind. Bruh. That’s most of it. Last year was warmer (less impact on irons than drivers), but the big difference was that this year wind was near zero. Last year it was steady (below 10 mph but steady), blowing at us from about the 9 o’clock position. And not for anything, please, please, please, for the love of golf ball fitting, stop obsessing over distance numbers. As we’ve noted, how you deliver the club will influence how speed, flight, and spin come together. So as I’ve tried to hammer home … Flight and spin … flight and spin, that’s what matters.
And about how the club is delivered … there’s way more to configuring a robot than just speed. With that, there are always going to be differences in attack angle, path, impact location. Lots of stuff that influences how the raw configuration of the robot translates to what happens at impact. This isn’t as a distance test. As I’ve said elsewhere, while I understand golfers want … maybe even NEED to see distance numbers, if it were up to me, I probably wouldn’t post them because of the obsession with them to the near exclusion of what actually matters with a golf ball. We do our best to hit launch and spin targets … we’re not looking to hit a ball speed number and we’re sure as hell not trying to hit a distance number.
2 months ago
Swing speed in low 80s but with 5-6* up AOA, higher launch and spin in low 2Ks I get the 125mph ball speed and similar (but a litter longer) ball carry than the robot test. 3K+ spin never happens for me, so hope you also provide data with positive AOA, higher launch and lower spin for us low ss guys.
2 months ago
The dashboard is really nice. Great job all around 👍
2 months ago
Absolutely LOVE the new dashboard. So much better than last year (when I first found MyGolfSpy). One thing I did last year is manually copy data for about 10 balls I was considering into Excel and then used AI to ask it questions such as: What are the top 3 balls for a golfer with low swing speed that is looking to maximise driver and iron distance, minimize driver spin, and maximise green side and full wedge spin. I then went on to prioritize sub prioritize my list of priorities. Worked great but boy was it a lot of work to copy the data. Would be greater to have access to downloadable data. Or even better if you built an AI widgit into your dashboard. Maybe something for next year?!
2 months ago
Love the data! But very curious how the Maxfli Tour X LS is higher spin, rather lower driver spin as marketed. And secondly, curious to how the Maxfli Tour X performs soo poorly on 7 iron carry! Make it make sense :)
2 months ago
Having regularly played the Maxfli Tour X and Chrome Soft, there is NOT 19 yards of difference in these balls off a 7-iron. If that were the case, I’d be flying greens with the Chrome Soft or woefully short with the Maxfli Tour X, and I’m not. This doesn’t pass the logic test for me, or apparently, many others.
2 months ago
Agreed. The flight path shows the MF X ballooning and landing short relatively. Having the highest descent mirrors this. But 20 yards difference, and the overall 7-iron results being dramatically different than last year for mid and low swing speeds is suspect. I hear they had headwind last year, but still the math ain’t mathing.
2 months ago
An 85 mph swing is slow? Not! Most seniors over 70 have much slower swings, I’m 87 w 75-80 swing speed and the big hitter in our over-80 foursome, and a good drive for me is 175 yds, a perfect contact will go 200 w roll and wind. And 227 yards avg drive for an 85mph swinger? No way, that’s the distance i got in my 50’s w 90mph swing speed.
2 months ago
yeah, it’s slow. I’m teaching a 55 year old woman that’s 5 foot 3, and she’s swinging around 82 already. At that slow speed, doesn’t really matter what ball your using. Use what you can afford.
1 month ago
According to this data, at 85mph there is over 10 yards difference in driver distance from best to worst. I don’t know about you, but I would love an extra 10 yards. And it shows over 18% variation in spin with the 7 iron. Amazing that only 3 mph slower, all the differences go away.
2 months ago
I love everything that you guys do. The data is outstanding! Gives me something to stare at for hours to influence my golf ball choice for the next year. lol Keep it up!
Feedback: I noticed you have the Kirkland balls at $39.99/doz. They are currently at my Costco for ~$15/doz. I think that information may have some influence on recommendations. I only noticed because of the previous recommendations for Value picks and seeing how they compared this year!
2 months ago
$39.99 for is the non-member online price that includes shipping. The in person warehouse price will be lower but not as accessible (I agree that they should probably halve this for the comparison given that they are not sold in single dozens).
2 months ago
I have spent entirely too much time in the data on this, especially given I have several dozen Vice Pro Plus balls in the garage to use. Interesting observation regarding the Vice Pro Plus from 2025 to 2026. Spin went up from 2529 (which is close to ideal for me) to 2929. I am pretty sure I have 2025 models in the bag so I think I am ok but that sparked my curiosity. I looked at the spin numbers from 2025 and 2026 on comparable balls to the Vice Pro Plus and the spin numbers are up on all 5 that I looked at: ProV1x left dash, Chrome Tour X, Maxfli Tour X, Chrome Triple Diamond and Wilson Mod X. In fact, the average spin numbers across all 5 balls went up by 292 rpms with the lowest being Wilson Mod X at 104 and the highest being ProV1x left dash at 427 rpm. I would not think the manufacturers intentionally increased their spin so is this a conditions, variables and constant issue? Are these different numbers statistically insignificant with regards to spin? Weather, humidity, clubs used, other variable? Anyway, a ball that spins mid-speed driver at 2929 is not the ideal ball for me so I kinda panicked since I will run out of my Vice Pro Plus stock eventually! Curious to know thoughts!
2 months ago
Note to everyone: Stop shopping golf balls with the “under dog” mentality. Titleist has the best at quality control….Period….. Stop wasting your money on other brands.
2 months ago
Noticed a trend with tour balls. The standard ProV1, Chrome Tour, Maxfli Tour, etc have better dispersion and also perform more consistently in the wet vs their X counter parts. Wonder what that boils down too. Very interesting.
2 months ago
Thank you for another interesting ball test. I’ve had a lot of fun trying different golf balls the past few years based on your results. I was pleasantly surprised to find the Taylor Made TP5 as a recommendation for my slower swing speed. I played it yesterday and noticed it flew further and, of course, spun more than my current gamer. The TP5 is now my gamer.
2 months ago
It’s possible I missed it, but where is the section on Full Swing Wedge? You have it in the table data, but there’s no detail section of the outcomes of that portion of the test.
2 months ago
Hi Jason,
There is a full swing wedge section in the table, just click the drop down that defaults to Fast Driver
2 months ago
I’m sorry if this was answered previously or elsewhere, but what do you do if you fit directly between the swing speed classifications? I swing the driver at right about 95 MPH. Should I be looking at the mid-speed results, the low-speed results, or do I have to look at both and come up with some kind of average? Also, are you really sure that 105 MPH is “mid”? That seems high to me. It seems to me that a true “mid” swing speed is closer to the mid 90’s where I am.
2 months ago
I have a similar issue and I have a 7i swing that is closer or at the fast speed and a driver that is in between mid and fast. MGS recommends using this data to narrow your choices and go test them with a launch monitor to dial in for you. At the very least, this list narrows your options based on what you want to see. Also, so many balls are bunched up within statistically insignificant amounts so they also have top and bottom charts to weed most balls out.
2 months ago
mid shows ss of 102, not 105. Are you closer to 86 or 102?
2 months ago
Unless I missed it, apart from the Kirkland balls, was there comprehensive testing in the differences in the white vs yellow balls in premium brands like Titliest Provx and callaway?
2 months ago
Will you also publish ball dispersion results i.e. which ball tested most consistent for each club and swing speed?
2 months ago
I’m actually happy to see so many Ionomer balls tested and if you’ve lost some swing speed over the years they seem to hold up in testing. I understand they don’t spin as much around the green but how many times are your chips short vs. long? for me a little roll out is fine. I’ve been going back and forth between the Kirkland yellow balls and the Maxfli Tour X yellow for the past couple years and I feel like I’ve had better results with the K-Sigs…might actually try the TruFeel since the Tour Soft is out of my price range. I see no need to spend more than $35 on a dozen balls at this point but I like all the data.
2 months ago
What are the tightest dispersion or most accurate balls for all swing speeds ?
2 months ago
What’s up with the wedge flights? I thought even-degree polynomials were in my past! Seriously though, curious how to interpret the flight path and some of the peak heights loosely lining up with the first apex.
2 months ago
In Australia the pricing structure is way different. I use the Srixon ZS Diamond which you can buy for $55 AUD. Pro Vs and TP5s are about $80 and $73 respectively. The performance jump is minimal for the price difference and this test confirms it for me! I’ll be sticking with the Srixons although i may do some testing with the XV based on some of the dispersion and distance data. Thanks for the effort, super informative as always
2 months ago
First and foremost, thank you for all the hard work putting this together. As usual, you exceeded my expectations.
I look for a ball between 70-80 compression and, of course, it has to be a urethane cover. After reviewing the data provided, I think I need to take a closer look at the Vice Pro Air. It may not be the longest or spin the most, but the dispersion was excellent and better than any other ball with a similar compression. I would never have considered this ball without your dashboard so thank you for the ability to drill down and find the data needed to make an informed decision.
2 months ago
I have found the Vice Pro Air and the Taylormade Tour Response to be solid offerings.
2 months ago
Where do you go to drill down on the data?
2 months ago
I’m pretty sure I read the whole article so forgive me if this was in there…the pictures of the top recommended ball for different swing speeds are nice. In addition to those, would it be possible to have some sort of decision tree graphic or some question and answer ball picker code web page to help people decide between all of these. I’m content with the ball I play with and probably won’t change but I bet there are some people reading this still wondering which ball they should consider switching to. Yes, the “My Golf Spy Recommends” image does this breakdown by swing speed which is nice. But, I think some would like a decision tree walking them through a series of questions to help them pick a ball similar how OEMs like Titleist have a Golf Ball Selector page on their site. Would be sweet if yall had one that went with this data or just a decision tree image that does that.
2 months ago
Great work MGS and UNRL staff! What stands out to me most is just how dang close the top 10 balls in each speed group are… pretty much throw a hat over them. I think this speaks to Tony’s comment that ball performance, quality/manufacturing consistency is becoming much tighter. Anyone think this happens had Callaway Chromesoft-gate never happened? Keep up the great work keeping the industry on their toes.
2 months ago
In February the Callaway rep suggested that I (95 mph driver speed, 3 hcp.) should use the newest Chrome Soft. I tried the Chrome Soft, Tour and Tour X (all 2026 models) indoors with a Trackman and discovered that the Tour X flew furthest, spun least on the driver and spun most on the wedge. So, I’m using the Tour X even though I don’t fit the expected profile.
2 months ago
The Maxfi Tour X is probably the best bang for the buck. They are right there or about there it a lot of the categories. You can get all of there lineup for $120 for 4 dozen!
2 months ago
I’ve been playing them the last 2 seasons. Driver Swing 99-105mph. Love it off the driver, and very good around the greens. But I’ve noticed I’ve lost about 5-7 yards on everything else. I now see it is the shortest in the test for mid swing 7 iron… May try the TM Tour Response – Give up 1 yard off the tee and gain 8 yards on the irons.
2 months ago
I want to see a dot distribution of the balls hit for each brand.. because if one brand is 2 yards longer than the other brand, but the distribution between the ball struck for that brand exceeds 2 yards the statistics become meaningless
2 months ago
In testing balls about a month ago, the biggest difference we saw was the change in the Left Dash! from the previous iteration. Not really a “Left Dash” ball anymore. It was consistently shorter off of the tee and noticeably had more drift in winds, making more similar to previously other Pro V1s. The original Left Dash is a superior ball. We also noticed that both of the TP5s were much improved over the last model. The constant seems to be the Maxfli Tour X. Was before and continues to be a great ball across the spectrum for good to great players!!
2 months ago
This is great information. I have a 6.2 index and have traditionally played ProV and Callaway Chrome soft, but bought Vice pro from Sam’s Club for very reasonable price. I shot a couple of 1 under par rounds and a number of mid 70 rounds with them in the last month. I’m struggling with side spin with my driver, and looking at the data it shows this ball spins a lot, interesting!! Not sure if I should go back to a ProV or stick with this ball? Score and performance is more important than how my ball looks coming off my driver. So I guess for me it comes down to how a ball performs for you!! Thanks
2 months ago
Thoughts on adding a mid-high swing speed? Buddies and I were discussing this post and debating which sections to look given we are in the 107-112mph driver swing speed.
2 months ago
Love the data and analysis, though I still think your definition of fast/medium/slow swing speeds are WAY off. Per AI, only 1-3% of golfers can hit it 116mph or higher. The average (MID) swing speed for an amateur golfer is 90-95mph, not 102 as you categorize it. I’d argue that anyone 100+ mph swing has a fast swing.
Again, really appreciate the testing MGS does, no one else in the industry even comes close to providing this data. I don’t make a golf equipment purchase without comparing data from MyGolfSpy first.
2 months ago
Thanks for the hard work, but for me, TMI. The proof is on the golf course.
2 months ago
I’m almost 80 now. My swing speed has diminished. It’s about 65 mph now. Lately I’ve been using the Callaway Supersoft. I was always a Pro v1 user. Any suggestions. My drives have gone from 280 yards to about 160 now. I’m using a Callaway Elyte max x driver. What ball would help me to get to 200 yard drives? Thank you.
2 months ago
no ball will do that, train your body and your swing. I suggest watching some Dr. Kwon videos on Youtube.
2 months ago
So, in the 2025 Test- Maxfli Tour X was middle of the pack in 7-iron distance for mid-swing speed. This year, it is dead last. Also, Chrome Soft was near the bottom in the 7-iron distance for mid-swing but this year it is the longest (#1). In both cases, it is the same version of each ball. Make it make sense.
2 months ago
They are monsters for me in the 7 and 6i! I’ve tested a lot of balls over the last year in the sim and outside. For me the best is the Maxfi Tour X, Bridgestone Tour BRX and the Vice Pro.
2 months ago
I like the Maxfli Tour X too, but this years data seems to suggest Maxfli Tour is a better fit due to only being a few yards short off driver than X, longer in mid iron and much better dispersion with driver and 7 iron. I used to be a Pro V1 exclusively, played with Maxfli Tour some last few years but this year switched to Maxfli Tour X although I have always liked feel of Pro V1/Maxfli Tour over the X on/around greens. May go back to Tour. Fwiw, 6 index, 102 driver SS. If numbers are close between balls it doesn’t matter (it’s all theory as we cannot perform like robots) as the biggest variable is our swing/ contact quality.
2 months ago
The Maxfli Tour X data for mid speed 7i seems suspect to me. They mention in the article it was dead last in distance due to a high peak height. But I would think those properties would carry over to the slow-speed 7i or high speed 7i, or both to some degree, but the distance values for those speeds place the Tour X near the top of the list (4th and 12th). Why the fall off all the way to the bottom at the mid speed? Curious.
2 months ago
It’s an interesting question, and I don’t have a great answer right now, except to say that it’s not entirely unusual. I’ve noted this discrepancy at mid-speed for a few tests now (this is at least the 3rd, so it’s repeatable). It’s most obvious in the distance numbers. Many of the longest balls at high speed are also among the longest at slow speed, but few are among the longest at mid speed. My hunch is there’s something in the flight and spin targets where slow and fast are more linear than mid and either (our targets are based at what golfers at a given speed do). There’s likely an aero contribution as well as dimples influencing how a ball flies, and it’s not necessarily linear with speed. Look at Snell PR4 for example. Peak height from the fast and mid drivers was nearly identical. At fast conditions, the aero package appears to create a distance advantage. At mid speed, with the unchanged peak height, it’s not leveraging the speed in the same way, so it’s not nearly as long relative to the control ball or the field.
This is part of why we built the speed sensitivity feature into the dashboard. Some balls objectively perform better (relative to the control ball) at one speed or another. Despite what the industry has told us, that’s not a compression story (it’s not about compressing the core), but there are definitely differences in how speed works with the flight and spin characteristics of the ball. Aero is undoubtedly a significant contributor to that as well.
2 months ago
I have been playing the 2023 Maxfli Tour S for the last 3 years so I know the carry I was getting with those balls. Recently was gifted a box of the latest Maxfli Tour X. With the X I was coming up noticeably short on the carry of my iron shots…almost a full club. I noticed it right away. When the X’s were gone I moved back to my stock of the Tour S. Distance remarkably came back. 80-82 mph a7 iron swing.
2 months ago
I’m very confused by some of it. Not just the ball models and whether they’re the same as last year, but more that the furthest carry for a mid swing speed mid iron was 150, but this year the lowest carry is 153? Chrome soft is carrying 22 more yards?! These iron numbers have something going on.
2 months ago
The mid iron target calibration conditions and club appear to be the same between both tests. However, the average ball speed was ~6 mph higher for 2026. This would likely point to either some models being faster and thus driving up the average (doubtful) or a different strike location on the face (more likely). Ultimately the test conditions are slightly tweaked with each test so you really shouldn’t compare results across tests.
2 months ago
I noticed this also. Confusing. They say balls and factories change, but prob not that much. I would strongly advise a robot test also to be included.
Lest we get lost in the complaints, WELL DONE MGS! No one else comes close to your effort.
2 months ago
Great stuff, y’all. Very surprised about Maxfli LS vs X.
2 months ago
I had the same thought. I was really anxious to see the data on the Maxfli Tour X LS, from the description (low spin, higher launch than the Tour X), I thought this was definitely the ball for me. I’d have to say the results are … disappointing. I’m glad I didn’t buy any until this testing came out.
2 months ago
Same here. LS advertised by Maxfli to drop spin off driver but keep everything else about the same when compared to the X. This test showed on fast speed driver the LS spinning about 200 RPM more than the X. But looks like LS has slightly lower peak height on driver and irons. Very interesting.
2 months ago
Ban the ungrateful nitpicking geezers from the comments section. It’s time.
2 months ago
102 mph is not a “mid-swing” club speed and for “high-swing” measuring at 116 is also very suspect. The results are skewed and not as helpful as they could be.
2 months ago
it’s totally accurate, I can swing my 5 iron at 102, that speed for a driver is mid for sure.
2 months ago
True, BUT… Others have rightfully pointed this out. Just pick the swing speed that fits yours, and don’t wworry about what label they put on it.
2 months ago
Really appreciate this information! Outstanding work! MyGolfSpy is the pinnacle of golf equipment testing I trust and look to!
2 months ago
“Off the 7-iron at mid speed, that pattern doesn’t just weaken, it flips.”
So uh, how much of this did AI write for you guys?
Classic AI drivel sentence.
2 months ago
Great work! Many thanks for what must have been quite a task. You guys are great!
Maybe I’m missing it, but do you have dispersion info? I’d like to know which balls were straightest in your testing.
2 months ago
click on each individual ball on the results chart, you’ll get a new page with all the dispersion data
2 months ago
Well written with clear explanations of the “how’s and why’s” this testing was performed and the impact on any of the data results.
Thanks to the My Golf Spy staff for all of their efforts in getting this information available to those interested.
2 months ago
FYI, your price for the Kirklands is incorrect. They are currently 39.99 for *two* dozen online and $29.99 for *two* dozen if you go in the store. Figured that might affect your value rankings a bit.
2 months ago
The new dashboard is incredible, especially the re-inclusion of dispersion. THANKS and congrats. Best golf equipment analysis of any kind, anywhere.
2 months ago
The dashboard tool is incredible. I couldn’t stop finding different balls and metrics to compare to each other.
So much great work done here
2 months ago
Great job as usual! Very helpful data… truly provides for individual decision making.
2 months ago
110% thank you all for your time and the efforts the staff has put into this effort. Alot of the technical data has a tendency to skip over my head. Thanks for keeping it at eye level for me. One very important thing to me again has been demonstrated. I don’t need to spend upwards of $18 more per dozen for premium balls. My ball may not be in the top1 or 2, but data is so close I would never realize that difference on the course.
2 months ago
I was very interested in the results that determined your comment about how brands and models varied so much in accuracy and what seemed to be consistency in manufacturing. Did I miss it in there or is that coming later?
2 months ago
Been playing TP5 and looks like I need to give Callaway Chrome Tour X an chance with a mid swing speed.
2 months ago
Great work. The 35 yard wedge data is extra interesting. Is the takeaway that greenside spin doesn’t really matter as much as claimed? The calculated roll out is the same across all the urethane balls.
2 months ago
I’m not a tester, so I can’t say for certain, but it looks like the rollout used is calculated using whatever algorithm in the launch monitor. As far as I am aware, the algorithm doesn’t know the ball cover material which of course is one of the main determining factors of stopping power. Different green conditions will also vary the stopping power compared to a “firm and fast” algorithm condition.
2 months ago
Titleist TruFeel it is. Most bang for my buck.
2 months ago
Wish the Seed SD01 and 02 were tested
2 months ago
how about a range ball in the mix next time? That’s what we all are practicing with and it would be nice to know if they are longer/shorter instead of thinking they are shorter.
2 months ago
This is an amazing piece of work, congratulations! However, I don’t see which ball can help me get out of greenside bunkers better??? Maybe I need to find the ball that keeps me out of them, still working on that.
2 months ago
Love the analytics and comparison on the dashboard. Instead of being a mouthpiece for the manufacturers (like some sites we know T_ _) you actually go and prove your findings….well done!!
2 months ago
Observation: wedge carry compared to total. Spin and launch matter not just spin.
2 months ago
So help me understand the logic, why would you test two colors of the Kirkland(the only yellow tested) but omit the Members Mark???
2 months ago
I’ve found dozens and dozens of lost Kirkland balls over the last few years. I’ve found maybe 3 MM balls.
2 months ago
The Kirkland yellow is manufactured at a different ball plan.
2 months ago
Interesting that the TP5x ranks pretty much in the bottom half for most metrics for mid swing speed (outside of high wedge spin) and is a top recommendation. I personally like it, but didn’t seem to put up great numbers, relatively. Guessing since there are 9 recommendations broken out in spin segments, they can’t all score towards the top.
2 months ago
Why 116 mph swing speed? That’s faster than PGA pros. Less than 1% of all golfers swing that fast. Please explain this choice
2 months ago
Totally agree. The 116mph is a wasted test, IMHO. Only 1 to 3% of golfers worldwide hit that speed. Seems like 105+, 95 and 80 would’ve been better margins.
2 months ago
They pick 85 and 115 as the bookends with 100 being the median, not a representative average of the population (the audience frequents equipment centric sites tends to skew faster than the average golfer). I believe they choose these speeds to cover a wide enough spread to provide value without adding a ton of extra overhead. The cost of adding more speed conditions would likely be less models tested (which some people would also complain about).
2 months ago
MGS has targeted 85 (low),100 (mid), and 115 (high) mph calibration speeds for every test since 2021 to represent an even spread. 116 mph was the average for the high speed condition this year (keep in mind that the robot does not swing precisely the same each time).
2 months ago
OK, fine … 115mph, that still represents 1% of all golfers. A wasted test. 110, 95 and 80 makes much more sense. And just because they’ve done it that way, doesn’t meant the test process shouldn’t be refined. They are constantly adjusting test criteria.
2 months ago
Excellent job with the analytics and putting in place the dashboard!
2 months ago
Love this guys. A couple of comments: isn’t the graphic flipped for low swing speed? I thought AVX was a low spin ball. Second, I know it must be difficult choosing balls but 5 or more from Bridgestone, Srixon etc pushes out balls that were requested like Precept Laddie, Oncore, Seed, Sugar etc. It seems you have tons of $50 per dozen balls but not many of the under $35 a dozen balls. Just the same, I love the work you guys are doing! Thanks for being my go to source!
2 months ago
Would love to see an overall top 3 ball recommendation for each swing speed. “All things considered, here are the top 3 balls…”
2 months ago
Tell me you did not read without telling me.
2 months ago
My favorite test of the year and the dashboard is 🔥
2 months ago
Can we also add sorting by dispersion?
2 months ago
Go to the dashboard and sort away.
2 months ago
Love the accuracy drill down in the data and the ability to compare to the field and select balls. After all, a few yards or mph difference is not the game most of us are playing. It’s the ability to know that we can rely on the ball to be within some tolerance for what matters most – in the fairway and closest to the cup! This would be a fantastic applied statistics class in college!
2 months ago
Where is the data for how consistent the golf balls are in quality? I want to know if some of my balls that go 30 to 40 yards off target are just terrible swings or if the ball im playing has inconsistencies in manufacturing?
2 months ago
Love the advanced analytics & dashboard!!!
2 months ago
Thanks for being here!
2 months ago
Have you thought about performing putter tests similar to these tests to see how the various balls perform distance wise off the putter?
2 months ago
You guys have produced the most comprehensive database. It’s so easy to dial in on specific balls and see how their flight, distance, and spin work for our swing speeds and clubs. As you said, there are trades with most of the balls for the swing speed we achieve. I really appreciate all the thought and hard work you guys put into this test and compiling all this data!!
2 months ago
We are happy to do it! The sole reason why we are here. Hopefully this leads you and golfers all over the world to their best ball!
2 months ago
WoW! Lots of very good information! Thank you! I know this type of testing takes a lot of time, and especially money, I appreciate all you do at mygolfspy. Just a mention, the most interesting ball test was several years ago when mygolfspy cut open golf balls. OMGOSH! That test woke up everyone in the golf manufacturing industry! I remember y’all found off center cores, weight issues, and issues with the covers, etc. Only one golf manufacturer had passed practically all testing, it starts with a “T”. All of the sudden, golf ball manufacturing tightened up their tolerances and made serious investments to their manufacturing processes. I stopped buying certain brands because of that article. Thank you for all you do at mygolfspy.com.
2 months ago
I posted this yesterday don’t why it is not showing? The 2025 ball test has the 35 yard left dash spin 5698rpm and the 2026 35 yard left dash spin 4997rpm?
2 months ago
I believe that was the 2019 Left Dash versus the new Left Dash.
2 months ago
Think you are correct. That spin difference does not represent the “marketing, the new ball will have greater green side control”. I guess they got that control with 700 rpms less spin LMAO.
2 months ago
Please include OnCore’s balls in next year’s testing. These fly under the radar, but I’ve heard several good players speak well of them so it would be great to see how each of OnCore’s balls stacks up objectively against Titleist and other stalwart ball brands.
2 months ago
Wayne Player trashed Lee Elder’s ceremony at the Masters by pushing OnCore’s ball. Tasteless and disrespectful move – if I find an OnCore ball I knock it in the pond/woods. Horrible choice in brand ambassador.
2 months ago
Thankyou to All that have put this incredible amount of data together. It is a great insight into what Balls and what level they are to be played at. Me personally. I will still be playing Titleist ProV1. Although costing is abit more than some (especially when you’re on a Pension😔) It’s imperative to know that it’s going to possibly go in the direction & at what spin rate as expected. Also since swapping to the ProV1 my Handicap has dropped.
2 months ago
Thanks for the info. It makes picking balls to test for our personal use less expensive.
2 months ago
Out of curiosity, exactly how is height and carry measured? Do launch monitors actually “see” the ball during the entire flight, or do they calculate expected height and carry by extrapolating from seeing how the ball leaves the clubface?
2 months ago
Is it possible to give a list of any balls NOT recommended due to too many cuckoo balls?
2 months ago
Thanks again for all the hard work. Since you mention a few times that carry is more important/less algorithm dependent than total distance, than why do all the tables in the article use total distance? Similarly, why even include 7i ball speed data if it’s all so close and distance and stopping power are more influenced by spin anyway? It always drives me nuts on the CBS golf broadcasts when they show ball speed on a 9i or wedge shot, like who cares??
Did I miss it, or will you have some observations on full swing wedge shots?
thanks again!
2 months ago
Thank you for taking the time to produce this in-depth of coverage the golf balls included. It is most appreciated!
2 months ago
Don’t take this as harsh criticism. What you do is very hard. Here’s my dilemma. I have played a variety of balls, notably: Titleist Tour Soft, Callaway Chrome Soft, Chrome Tour, and Bridgestone E6. I have played well with the E6 and Callaways, each with it’s own pros and cons. By comparing data, I can get a glimpse of what MY SWING likes about each ball, but I can’t find data on the E6 to understand why an inexpensive two-piece performs so well against the other premium options. Maybe a test of non-premium balls with the same rigor as premium balls would be an option. You could then merge the data and allow cost to be a factor for us to determine. The less expensive balls have to be some of the best-sellers, too! Or have I grossly missed the numbers on the E6 and E12 golf balls??
2 months ago
Great test and love the details. Some surprises in there as well!
2 months ago
Lots of great information and almost overwhelming. Thanks for all the work and extra effort done to put this together!
2 months ago
Which ones are the balls that listen to you when you talk to them?
2 months ago
Sorry, all golf balls are In their teenage years and rarely listen to adults,
2 months ago
Thanks to you and the MGS staff for your hard work and dedication to finding objective outcomes. Having followed the MGS ball testing since the first ball test, it is apparent that the MGS team takes these evaluation seriously and evolves the testing in each iteration to constantly improve the information you provide your readers. Your evaluations cuts through the OEM’s marketing claims, plus the minutia and general misinformation found across the internet. My only suggestion for the future is to possibly add a fourth swing speed category (i.e. driver < 75 MPH) to provide similar information for your female and senior readers. Both are a growing segment of the golfing population that could benefit from your testing and insights. Many of them take their games just as seriously as the faster swing speed players.
2 months ago
Yes! I think the same thing every year when I read the MGS ball test. I am 76, female, with a swing speed around 78mph. Next to many other senior women players, I’m still “long” but not really represented in the test. Most of my senior women golfing friends have no idea of what ball(s) to use, so they play what they see other women set on the tee…. I see a ton of Callaway Supersoft and Srixon Ladies Soft Feel, and lately, maybe because they’re pretty, Taylormade Speedsoft. I want the most well-rounded ball with moderate compression so I use the TaylorMade Tour Response, based on MGS findings over the past few years. My friends don’t know much about golf ball characteristics but perhaps they would learn if someone bothered to give them useful information.
2 months ago
“provide similar info for female & senior readers that could benefit from your testing”
Agree 100%.
That being said, this far and away the most readable of any ball test anywhere.
Great work.
2 months ago
honestly, when you swing that slowly, the ball really doesn’t matter. Buy the cheapest ones
2 months ago
Curious that you chose Scottsdale as the test location. One, you risk brutally hot weather. Two, the elevation (2165′) is perhaps meaningfully higher than where most of your readers play. High temp and high elevation both lower air density relative to presumed readers’ norms and would be expected to influence aerodynamic factors. A ball optimized for sea level may not work so well there.
How about testing somewhere lower and cooler next time? If not practical for the whole ball test, maybe test a handful a balls elsewhere to see how aero shakes things up.
2 months ago
Apparently you didn’t read the explanation that that yes the higher elevation may not be relative to where you play. But all balls were tested in the same conditions, they even paused during an increase in wind. So the results should be compared to the performance of the test, not compared to how you hit your ball.
I don’t know of any manufacturer that design a ball to perform differently based on sea level.
Talk about picking nits!
2 months ago
They have to go where the infrastructure exists which is mainly in the southwest US.
2 months ago
Yeah if you could do the next test 2000 feet underground next time that would be great.
2 months ago
Great work! Thank you for the results! Maybe just mybe an old codger like me can find a ball that work again.
2 months ago
As always, the most detailed and comprehensive ball testing methodology and results available. The amount of data and effort that goes into this is incredible. Really appreciate everything you guys do for golfers and for bringing some objectivity to the equipment conversation.
2 months ago
Incredible! Absolutely the most thorough test data I’ve ever scene, and the spreadsheets are amazing.
2 months ago
I’m still reading this article (stuff like this is never TLTR….) but can a case be made to use a different ball on a par 3 than a 4 or 5 where you will be using a driver? Since 6.3 allows a different ball at the tee from hole to hole it seems this may make sense as a strategy.
2 months ago
interesting idea! I need low spin with my driver and more spin with my irons. On the other hand, using a lower spin ball off the tee will take aways spin around the green. To help that, I lower the loft on the driver. Another issue for me is that I am fast with irons and mid swing speed with the driver and if you are, of course, playing by the rules, you don’t switch balls mid hole. I really like the accuracy numbers in the data as I think if you can get a quality ball that is accurate, some of the other metrics might not matter. No free lunch in physics!
2 months ago
This article is why I subscribe to MyGolfSpy.
2 months ago
Damn! That’s a very extensive and thorough report. I appreciate everything that everyone at MyGolfSpy does for us, the readers and fans of golf.
2 months ago
I would like to see you test super cheap balls like nitro as a comparison to the expensive balls. Is there really a difference or is it marketing?
2 months ago
price is a variable in the data and you can compare it against other metrics. Look at the Amazon ball as a starting point!
2 months ago
Thanks for all of your hard work as always. Great info!
2 months ago
Interesting article. I am surmising that different swing types of swinging an iron versus a driver cause different contact points in the ball. Wondering if the test can be expanded to show cut away of top 5 in each category of balls. There are rumors factory issues causing ball interiors to be inconsistent.
2 months ago
Great article as useful. I’m really interested in some of these dispersion numbers. Looking at my Maxfli Tour X and the fast 7 iron dispersion figures which look pretty poor.
2 months ago
I am really curious about those dispersion numbers as well. Everything else about the Maxfli Tour X stacks up to the top balls, but the dispersion is concerning. I cannot figure out why it would be so different in that one area.











Donn
6 days ago
Great searchable sortable database. I look at slow speed driver, there is an 8 ft height spread from hi to low and 13 yd total distance from long to short in urethane, but only 10 yds spread in both covers, and only 5 yds diff in ionomer only. Lower height does correlate, not 100% but good enough for real world, with longer yds. Thanks. Santa will see my list.