

Ahhh center of gravity. How exciting.
No really, it is exciting…or at least interesting.
While the average golfer may not know what center of gravity is, or why it matters (in fact, he may not even care), there’s a reason why it (CG) is a part of the discussion that accompanies nearly every driver release.
PING’s centers of gravity have traditionally been low and back. In the not so distant past, TaylorMade was promoting low and forward. This year, Cobra’s Zero CG placement might be trumped by Callaway’s new Sub Zero CG driver.
But what does any of that actually mean, and of equal importance, who is actually telling the truth about CG location?
That’s what this post is all about.
Today we’re going to show you exactly what’s real when it comes to the actual center of gravity placement of this season’s hottest drivers. By the time we’re done, hopefully you’ll understand why it matters too.
Before we dig into the data, especially if this is all new to you, we suggest that you rewind and take a look our related stories from last year. While I won’t say it’s required reading, our Golf Geek’s – How Center of Gravity Makes a Huge Difference story will give you the foundation necessary to fully understand the data presented here. You may also want to check out 2015 Driver CG Data.
The Fine Print
(A quick reminder from last year)
Before we get to our dynamic charts, it’s important to understand that although heads were measured according to USGA standards, tolerances (both in measurement and in manufacturing) come into play. The tolerance for our measurements is approximately .7mm. To account for this we represent CG using large dots rather than a smaller absolute point.
We should also note that of the companies that publicly state driver CG locations, most do so based on measurements from CAD drawings. Between manufacturing, assembling, welding and polishing, CAD projections don’t always align with the finished product. Our data comes from actual retail parts.
Where the dots in our charts are touching or are in close proximity to one another, it’s reasonable to assume the heads offer similar performance.
Finally, although we’ve blown these charts up to make them a bit easier to read, every last one of the CG locations represented is within that tiny little 14mm x 12mm box we described in our CG Primer.
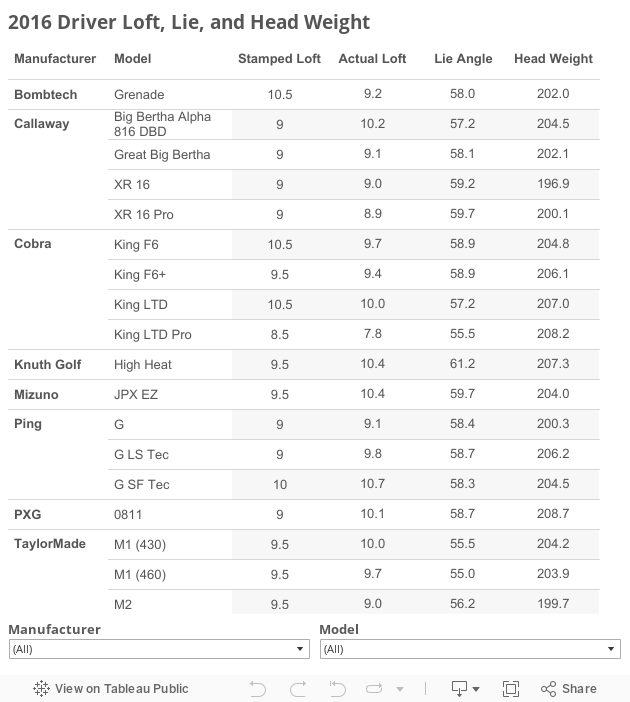
Loft & Lie (New this Year)
You may already be aware that the loft stamped on the sole of your driver isn’t likely to be the actual loft. And since loft plays a big role in CG location relative to the neutral axis (all other things being equal, the CG will be closer to the neutral axis with a lower lofted club), you should know the actual lofts of the drivers measured.
It’s not uncommon for the actual loft of a driver to be .5° to 1° of loft above what’s stamped on the sole. Manufacturers do this, particularly in models targeting average golfers, because so many golfers’ egos won’t allow them to play the loft they actually need. The practice of vanity lofting exists to protect the golfer from his own worst enemy – himself.
And that’s before we start talking about tolerances.
The chart below shows the actual lofts of the drivers measured to collect our CG location data. For additional reference purposes, we’ve also included lie angle and head weight.
Lie angles can also provide performance clues. The more upright the lie angle, the more the club will point left at address, and where the club is pointed at impact is where the ball starts.
Finally, you can use the Manufacturer and Model dropdowns at the bottom of the charts to display only those brands and/or individual models you want to see.
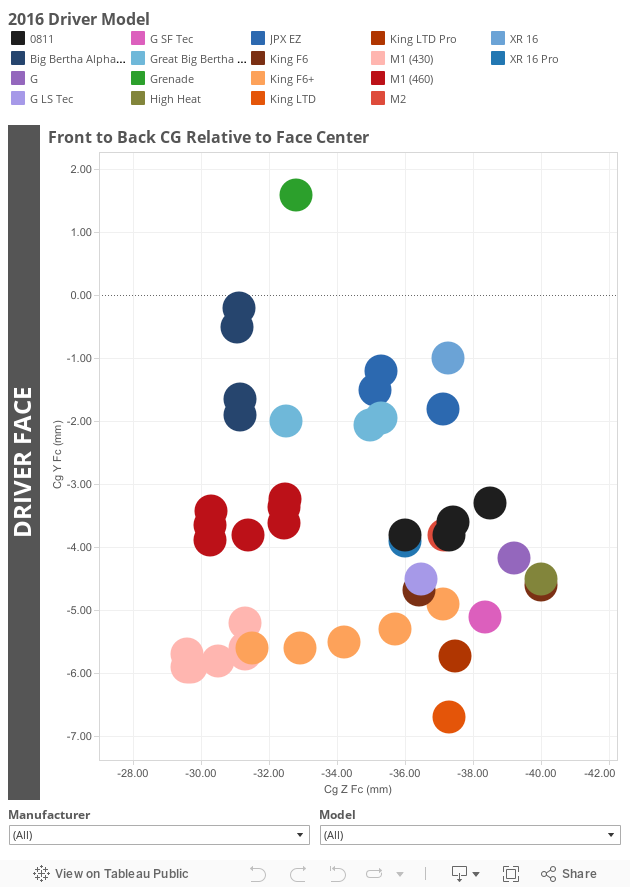
CG Relative to Face Center
The chart below shows the YZ (top to bottom and front to back) CG location relative to the center of the face for the 18 drivers measured. Effectively, the area shown represents that 14mm x 12mm box we mentioned in the fine print section. These measurements depict CG locations without consideration for their relationship to the neutral axis. As such they are not loft dependent. Basically, the chart shows the actual CG location for each driver measured. In addition to the Manufacturer and Model filters:
- You can click on any model name at the top of the chart to isolate that club
- Hold down Ctrl while clicking to isolate multiple clubs.
- Hovering over any dot will reveal additional information including the relevant movable weight setting and the actual measurements in millimeters.
For even more information, including comparative data from 2015 drivers, check out the Advanced Data Page.
Observations
- The TaylorMade M1 430 is notable for being aggressively low and forward. This suggests a good fit for higher swing speed players who hit down on the ball.
- The Cobra KING F6+ offers the most impactful adjustability; showing significant CG movement from the front to back weight positions.
- While it hasn’t been measured yet, our expectation is that Callaway’s Sub Zero will be somewhere between M1 430 and F6+ (front weighting).
- Cobra’s KING LTD offers the lowest CG of any driver measured.
- We expect PING to offer low and back CG (on a relative scale), but it’s somewhat surprising to see both Cobra (F6) and Knuth’s High Heat being a bit farther back still.
- Despite being described as having a low/back CG, the Bombtech Grenade clearly has neither.
The Neutral Axis

As illustrated by the image above, the neutral axis is an imaginary line running perpendicular to the center of a lofted driver face. Before you ask, let me tell you why that matters. As the center of gravity moves closer to the neutral axis you get less gearing (twisting), and a more efficient transfer of energy between the club and ball. As with everything else in our CG discussion, the distance from the center of gravity to the neutral axis (or CG NA as it’s called for short) is measured in millimeters, and as we’ve already discussed, those millimeters matter.
Worth restating from 2015’s post: It’s also important that you understand that because of where reality dictates the CG must be, and the front-heavy nature of a driver, it’s much easier to move the CG forward than it is to move it backwards. The farther back the CG is, the harder it is to keep it close to the neutral axis. Simply put…low and forward is relatively easy to achieve. Low and back is more difficult, which is why you don’t see many true low/back designs.
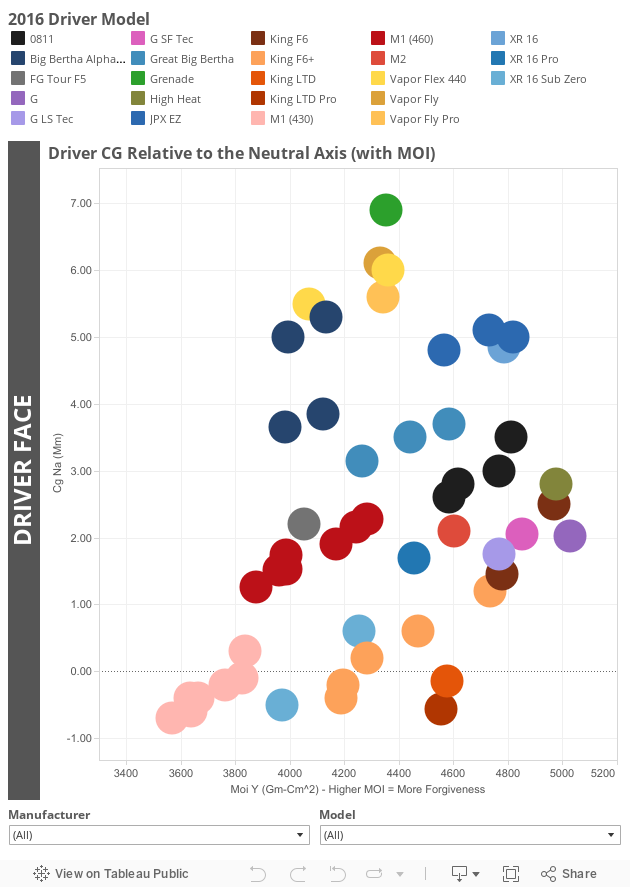
Many golf companies advertise some variation of fast and forgiving, and while you might not realize it, that has everything to do with the center of gravity relative to the neutral axis. If we assume reasonably centered contact, to be fast, to reduce gearing at impact, and to maximize the efficiency of the strike, the center of gravity needs to be near the neutral axis. To be forgiving, MOI (also shown below) needs to be high. Despite what various marketing claims may lead you to believe, truly fast and truly forgiving is perhaps the most difficult combination to achieve. Here’s our 2016 CGNA & MOI Chart. Same filter rules apply. (Note that because both the data and the scale is fundamentally different, this chart cannot be directly compared to the Front to Back chart above.
For even more information, including comparative data from 2015 drivers, check out the Advanced Data Page.
Observations:
- As was the case in 2015, PING has the highest MOI driver currently available on the mass market. All 3 G models offer well above average MOI
- Knuth and Cobra (F6 – back weight) aren’t far behind
- While M2 offers above average MOI (average for this set is just under 4350) both M1 & M1 430 are below average MOI offerings
- From both a CGNA and MOI perspective, the JPX-EZ (high/back) is vastly different from last season’s JPX-850 (low/forward)
- 4 Drivers – TaylorMade’s M1, Cobra’s F6+ (front 2 weight positions), KING LTD, and KING LTD Pro have center of gravity locations below the neutral axis
- The Grenade’s CG location is literally almost off the chart. It’s higher than we’d expect for Nike drivers
- With the exception of XR Pro, Callaway’s offerings tend to be higher CG than its competitors
- While the F6+’s track weighting system produces the most significant total CG movement, M1 also provides significant CG movement
- On a comparative basis, adjusting weights on Callaway, PXG, and Mizuno drivers produces a lesser shift in CG locations
So Which CG Location is Best?
As you might imagine, there is no single center of gravity location that is ideal for everyone. Clearly different manufacturers have different philosophies, or at a minimum, different design and manufacturing capabilities. There is anything but universal agreement.
We believe that the widest part of the bell curve will achieve the best results with relatively high MOI and relatively low CG drivers. Slower swing speed players, who need help keeping the ball in the air, generally do well with high/back designs. Golfers who are in desperate need of spin reduction (often aggressive swingers who hit down on the ball), will likely get better results with low and forward CG drivers, even at the expense of forgiveness. Like anything else, high MOI is not for everyone. For golfers who consistently hit the ball high on the face, a higher CG driver may produce better results, while golfers who habitually strike the ball low on the face will likely benefit from lower CG clubs.
As we’ve said countless times, in golf there are no absolutes, but we believe that by identifying a general center of gravity location that works well for you, you’ll be able to quickly narrow focus to a few clubs that offer the highest probability of producing better results.
Your Homework
As an experiment, try splitting our chart 4 ways. If you’re feeling motivated, split it 6 ways. Go out and compare clubs from the different areas you define and see if you find that clubs perform more similarly within boundaries, and quite a bit differently across them.
But Wait, There’s More (if you want it)
For those of you still with us, we’ve created an Advanced Data Page.
In addition to larger renderings of the charts already shown here, we’ve created a chart to show you XY (top to bottom and left to right) CG locations. This will give you an idea of which drivers are draw biased, and which are fade biased.
We’ve also created an MOI chart that provides data for both horizontal and vertical MOI.
Finally, for you YZ and CG/MOI Charts we’ve included our 2015 data so that you can see how this year’s drivers compare to last year’s models.


Jack
7 years ago
Tony & MGS Team — as always, thank you again for another AWESOME article. This is yet another dimension where you’ve given power to the consumer. Truth be told I think this piece is not too far behind the ball testing you’ve run. Great work.
MyGolfSpy
7 years ago
Thanks for taking the time to read them and reach out Jack!