How Do You Measure Up?
What separates players from pretenders? Where does the average golfer really struggle? How much difference could one more par per round make?
Today we’re going to try to answer all of those questions and more as we take a closer look at golfer performance by handicap. Along the way we’ll show you how golfers of varying ability levels compare across several metrics, and provide you with some clues that help to explain why golf products are marketed the way they are.
To bring you this information, we’ve partnered with TheGrint, a Golf GPS and Handicap/Stat Tracker. TheGrint’s massive database provides absolutely incredible insight into the makeup of the golfing population as a whole.
How Data was Mined
Data was captured from TheGrint App and Website.
We used a total sample of 15,000 golfers who:
- Are part of a USGA Compliant Golf Club
- Have uploaded at least 5 scores to TheGrint
Abnormal scores (scores with handicap differentials lower than -10 or higher than 45) were removed from an initial sample of over 300,000. While it should be obvious enough, it’s worth mentioning that our data is limited to golfers who track their handicap. It’s also reasonable to assume that data from TheGrint skews towards a more tech-savvy golfer, and that could also suggest a demographic that is, on average, younger than that of the total golfing population as a whole.
With that said, let’s look at what we found out.
Distribution by Handicap
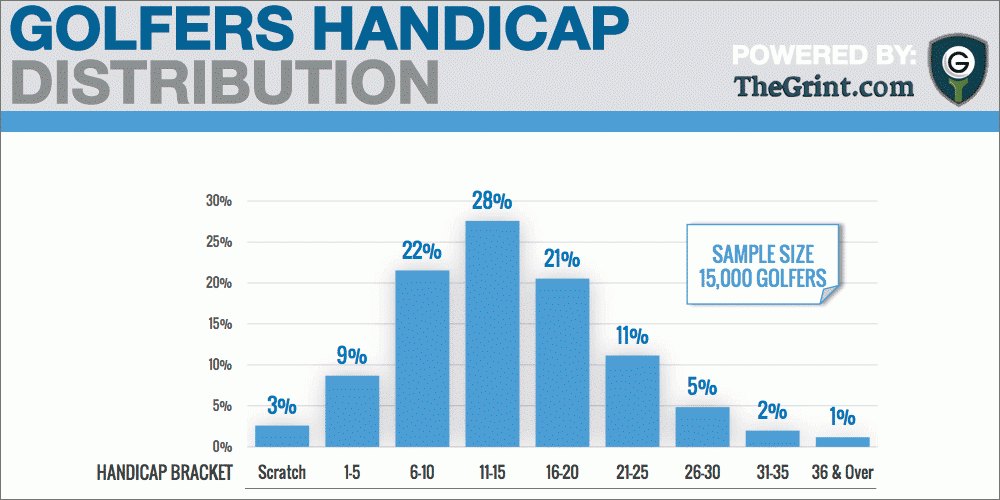
This graph shows the distribution of handicaps among golfers who track their scores with theGrint. This provides the foundation data that helps us to define the average golfer (based on ability level).
Insights:
- The highest percentage of golfers who track their scores is found in the 11-15 group.
- A comparatively small percentage of golfers with handicaps of 20+ track their scores. This could indicate that the majority of that group doesn’t keep a handicap, and may not even keep score.
What would be interesting to better understand is what motivates a golfer to keep score? Do we reach a certain ability level and decide it’s time? Are we driven to better understand our games, or do most of us simply need to be tournament legal?
Scoring Percentiles
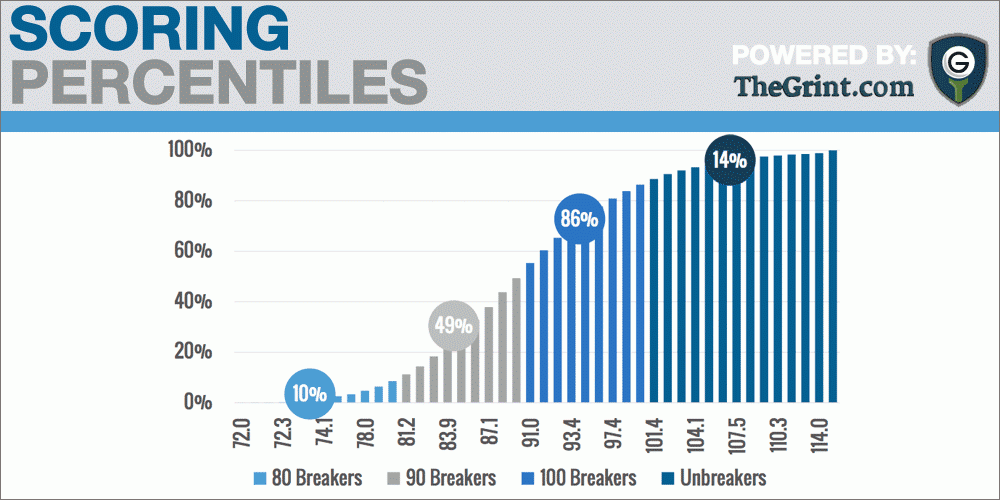
This graph illustrates the cumulative percentage of golfers who break 80, 90, and 100 on a regular basis. If you’re looking for a reason why it doesn’t make financial sense for a golf company to cater exclusively to better players, the answer lies in this data.
Insights:
- Only 10% of golfers who track their handicap break 80 on a regular basis. Let me say that again. Only 10% of golfers break 80 on a regular basis.
- 49% of golfers break 90 on a regular basis.
- 86% of golfers break 100.
Where would you spend your marketing dollars? Success hinges on the average golfer.
Of course, there are things the data doesn’t tell us. How long does it takes the average golfer to break 100? How much harder is it to break 90…and then 80. We’re going to need more data.
Birdies, Pars, and Bogeys
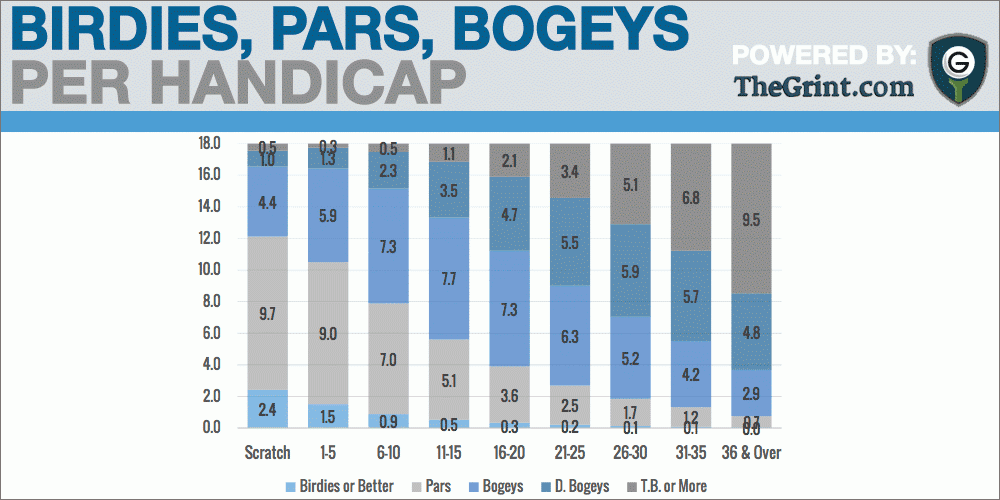
While the following graph looks scary, it’s not nearly as complex as it look. It is interesting, however; as it shows how many birdies, pars, bogeys,etc. each handicap bracket makes per round. For example, note that the 11-15 handicap bracket makes .5 birdies per round (1 every 2 rounds) to go along with 5.1 pars and 7.7 bogeys per round.
Insights:
- While many believe better golfers make several birdies per round, the data suggest that eliminating big numbers (double bogey or worse) is actually the key to significantly lowering your scores.
- The chart provides an excellent guide for what it takes to get to the next level. For example, you can easily see where your game falls short compares to the average of those with similar or better handicaps. Getting to the next level could be as simple as making one more par per round or eliminating a single blow-up hole.
Strokes Over Par
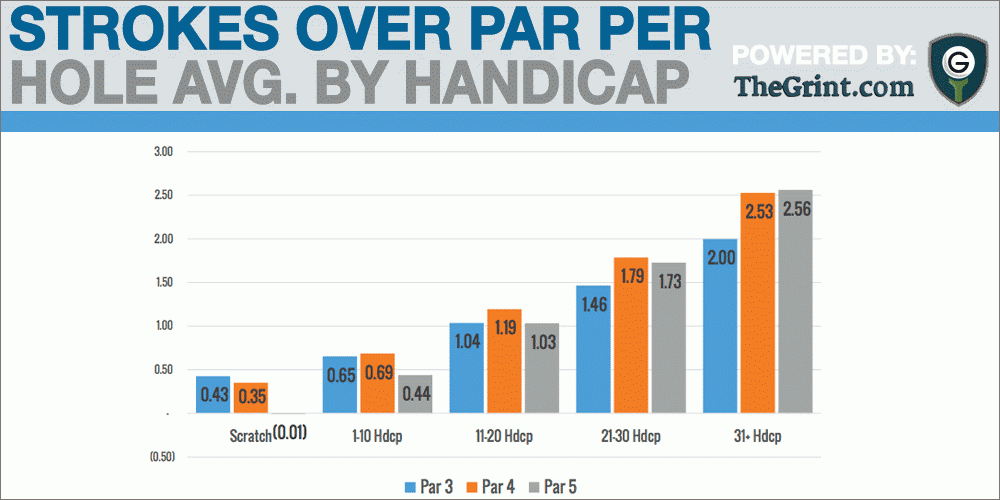
This graph shows the average score relative to par for all holes. For example, Handicap 1-10 golfers score 0.65 strokes over par on par 4 (an average of 4.69).
Insights:
- Very good golfers excel on Par 5’s, but comparatively struggle on Par 3s while less skilled players perform comparatively better on Par 3s, but struggle with Par 5s.
The discrepancy is likely explained by the fact that good golfers are generally longer and more accurate with the driver and often leave themselves with shorter shots into greens. Par 3s for better players tend to be longer (back tees), which often means a long iron is required.
Less accomplished golfers struggle with Par 5s because they present more opportunities to miss (hit bad shots), while Par 3s offer a scoring advantage because they often play 150 yards or less from the forward tees.
Coming Soon
Is there a correlation between age and golfer performance? In our next study powered by TheGrint, we’ll show you what the numbers say.


RANDY LOGUE
1 year ago
LIKE TO BE SIGNED UP ..AT 76 LIKE TO SEE THE MATCH UP PLAYING THE SENIOR OR SUPER SENIORS SCORES AND TEES. FIRST TIME WRITER.
REGARDS,
RANDY
Howard Jahre
11 months ago
Hi Randy,
I’m 75 and a big proponent of Four Magic Moves by Joe Dante. I read your review on Amazon and decided to reach out. Are you still using his system? How far can you hit your driver using the backward wrist break? No doubt the system works but for me I need to make a full shoulder turn with my back facing the hole to make sure my hips ( and not my arms and hands) initiate the downswing. Learning to keep my arms and hands “ wooden” has been a challenge but no doubt the ball is compressed and goes straight when I execute the shot properly. It’s also been challenging to initiate the backswing with the backward wrist break. Any comments or suggestions would be most appreciated.