


Continuing our Smarter Golf series with Arccos, we took a deeper dive into driver distance. We have published articles on driver distance based on your handicap alone but they leave age out of the equation.
A 30-year-old scratch golfer and a 60-year-old scratch golfer may have the same handicap. They are probably not the same player off the tee.
Age has an effect on distance and, thanks to Arccos, we can look at that relationship using nearly 10 million driver tee shots from real rounds. We also have data for women golfers.
The goal here is simple. Find your age. Find your handicap. See where you stack up.
Men’s driver distance by age and handicap
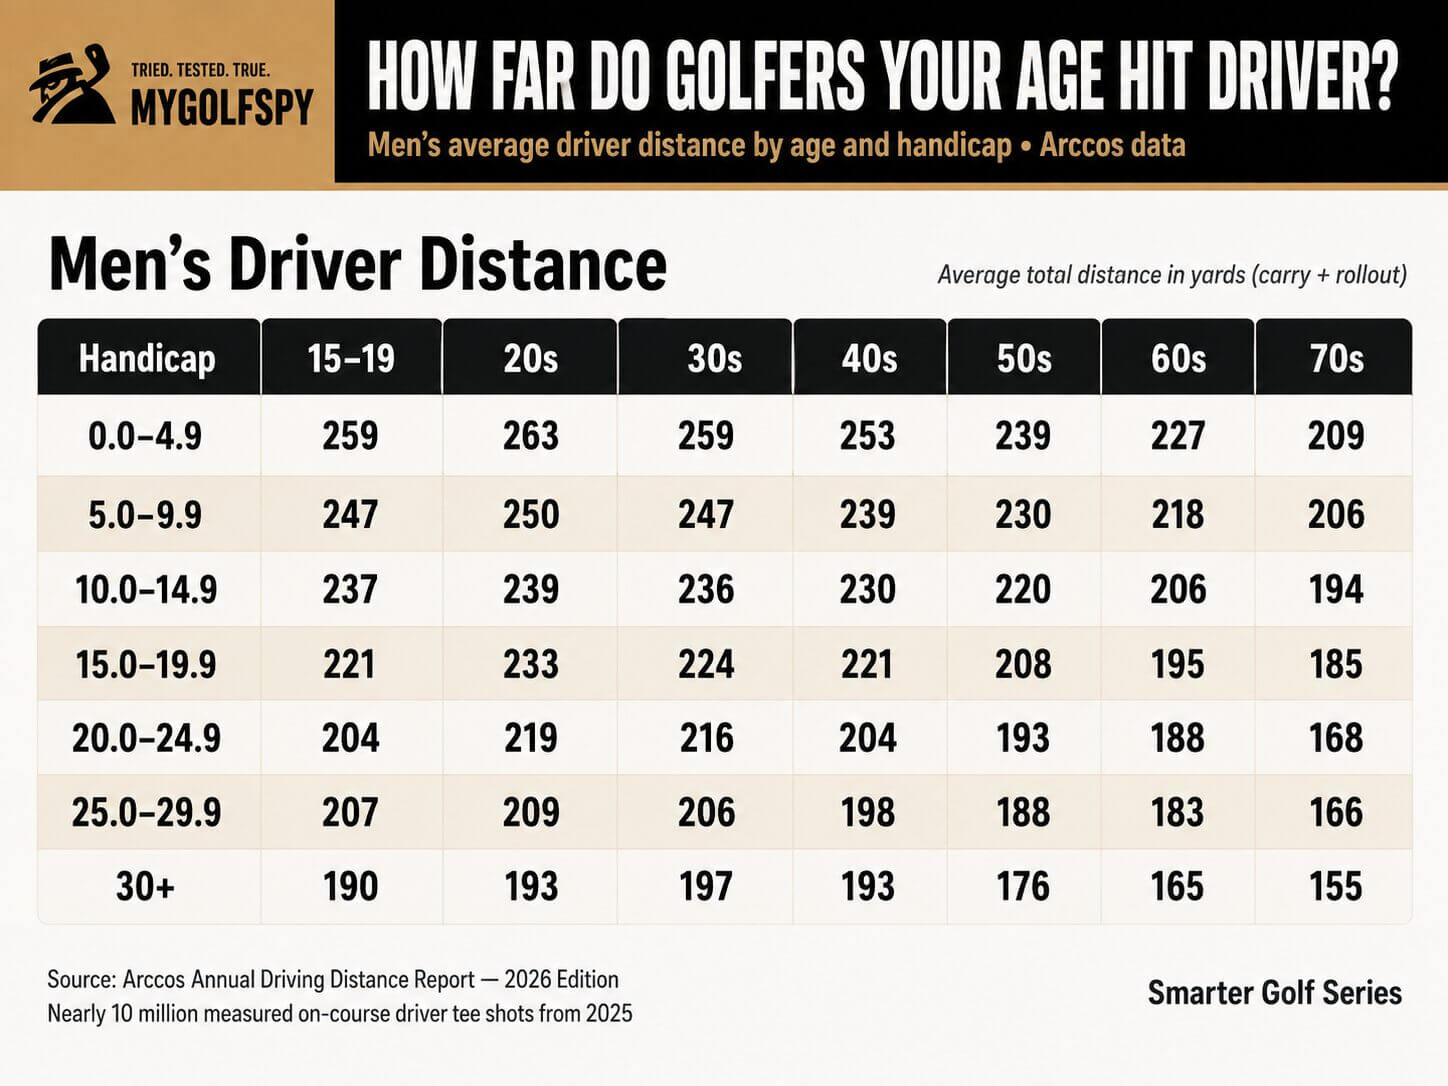
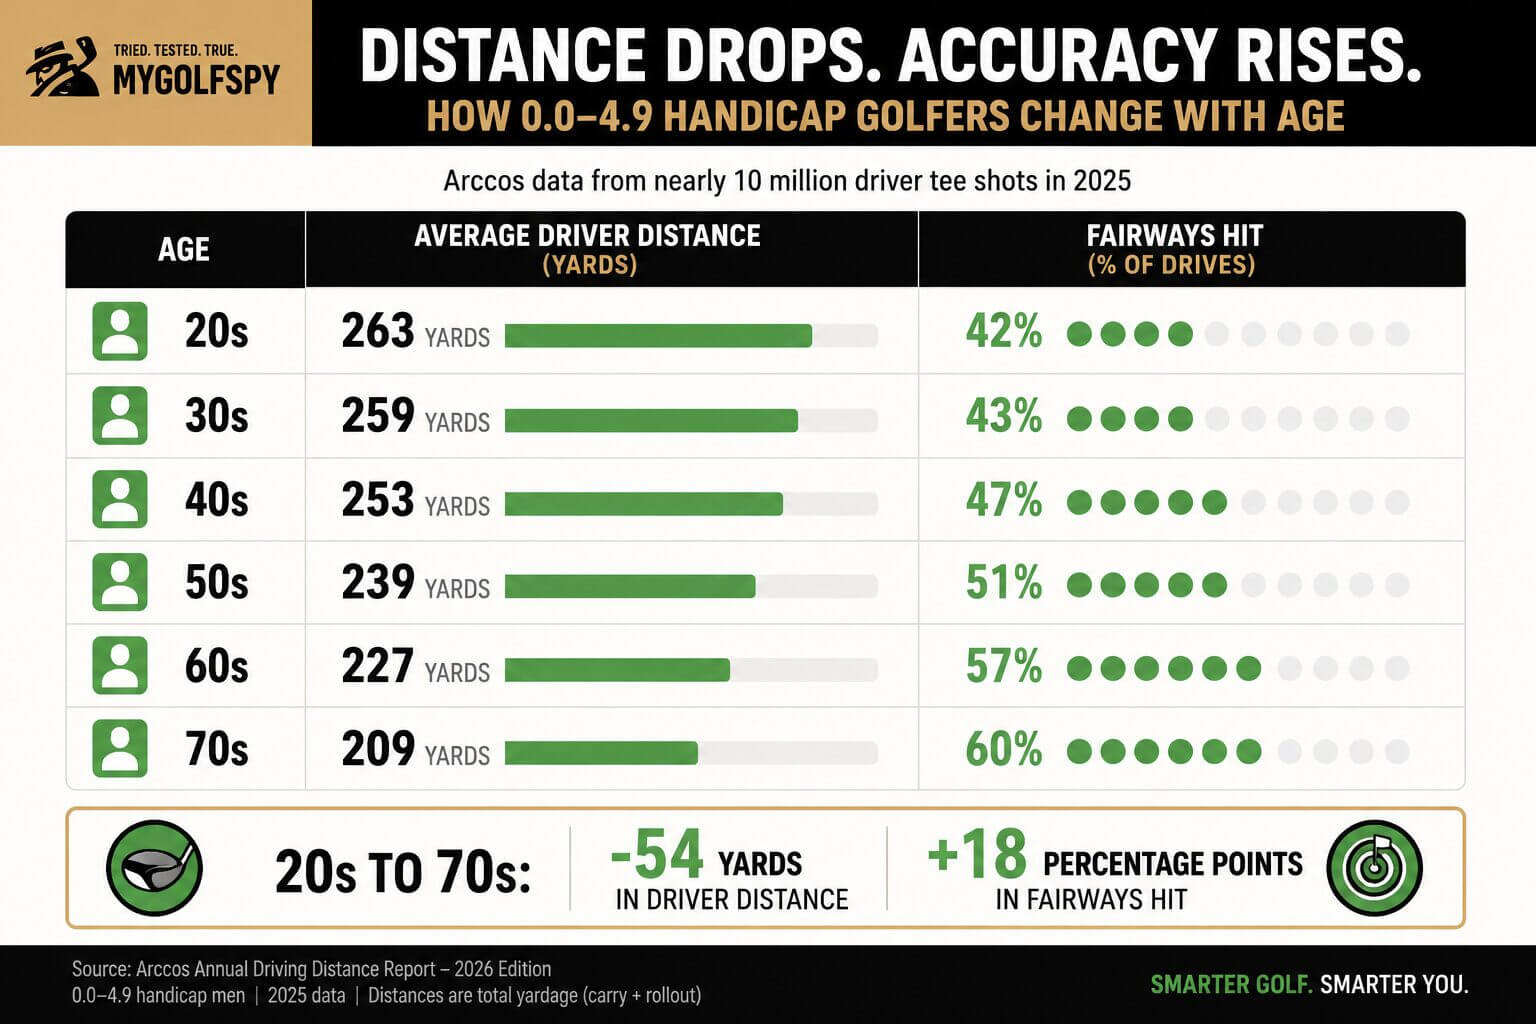
A male golfer with a handicap between 0.0 and 4.9 averages 263 yards in his 20s. By his 40s, that drops to 253. In his 60s, it’s 227 yards. A scratch golfer in his 70s averages 209.
It’s also worth looking at the chart before deciding what counts as “short.” Only one group in the entire men’s age and handicap matrix averages more than 260 yards. That’s the 0.0 to 4.9 handicap group in their 20s at 263 yards. If you’re asking average golfers how far they drive the ball, the common response is 250 yards. That may not necessarily be true.
This data gives us a much more realistic (and on-course) idea of what golfers are doing over a collection of real shots instead of judging distance by the best drive they hit all month.
Our instruction content combines insights from equipment testing, data analysis, and golf experts to help golfers improve with evidence-based advice. You’ve fixed one part of your game. These guides help you take the next step.
🎯 What tees should I play? Use this chart!
🛑 How should the driver sit at address? Many golfers still get this wrong!

Women’s driver distance by age and handicap
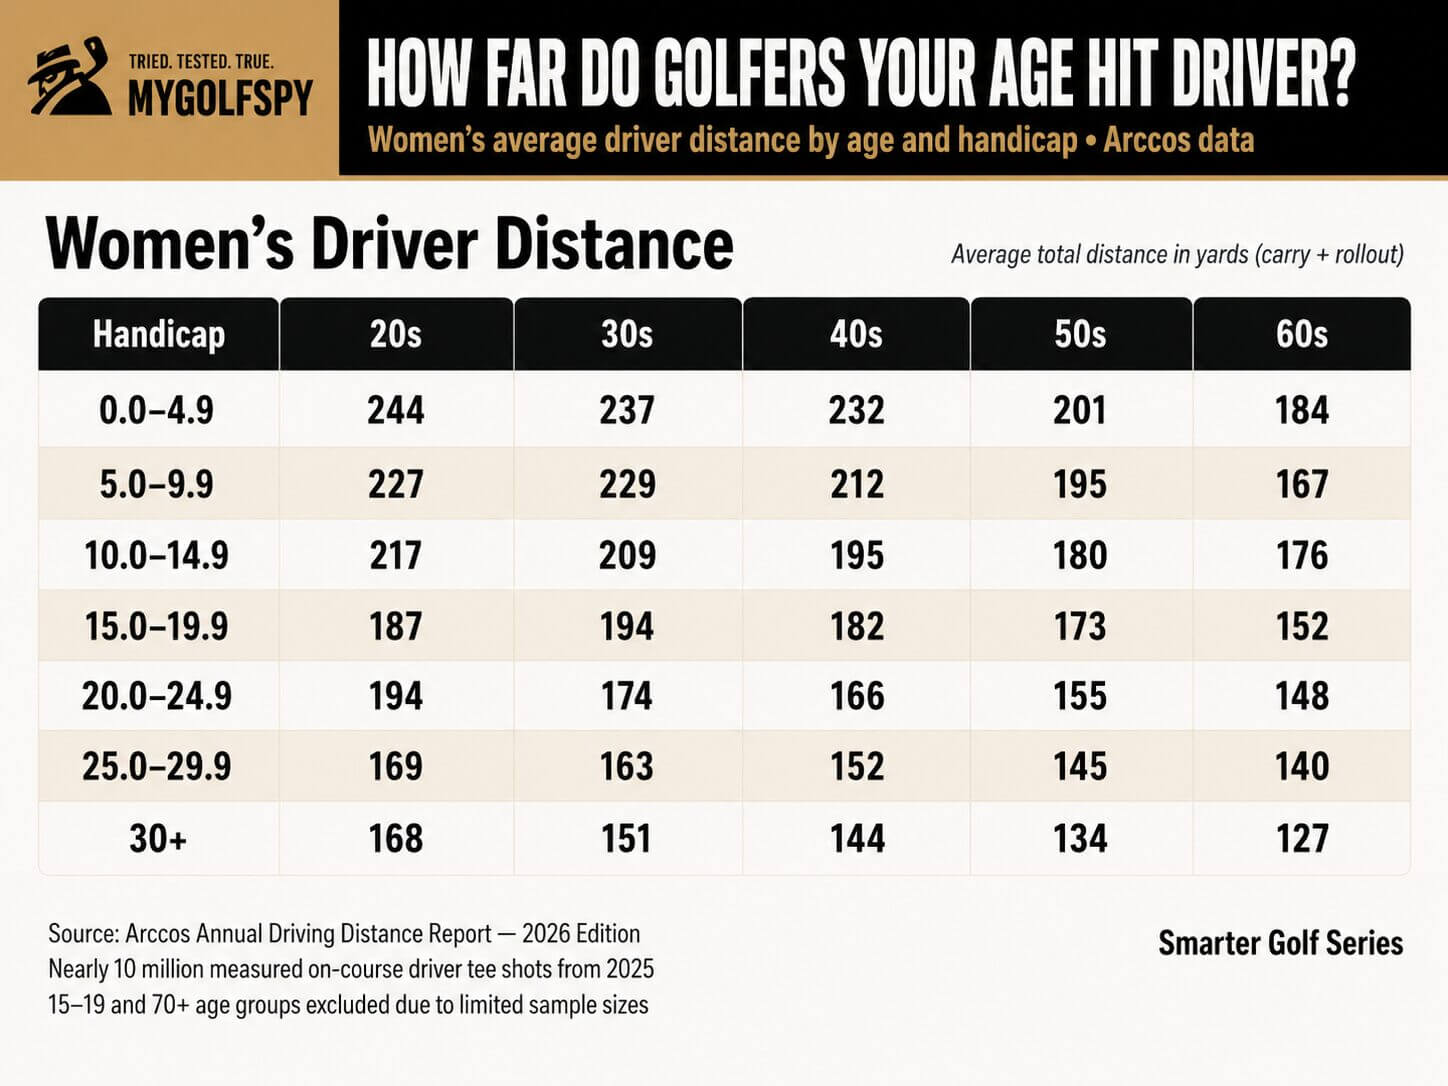
Women with handicaps from 0.0 to 4.9 average 244 yards in their 20s and 232 in their 40s. By their 60s, the average is 184 yards. A woman in her 30s carrying a 10.0 to 14.9 handicap averages 209 while a player in the same handicap range in her 60s averages 176.
This is why one generic “average female driving distance” number isn’t all that helpful.
The 15 to 19 and 70-plus age groups aren’t included in the women’s chart because Arccos did not have large enough sample sizes for those groups.
Losing distance doesn’t necessarily mean you’re getting worse
There’s another piece of this data I think is important, especially for golfers who have started noticing that the ball isn’t going quite as far as it used to.
Look at low-handicap men.
From their 20s to their 70s, average driver distance falls from 263 to 209 yards, a loss of 54 yards. Over the same period, fairways hit increase from 42 percent to 60 percent.
You can lose distance and still play very good golf.
That doesn’t mean you should ignore speed or stop trying to maximize the distance you have. It means a 65-year-old three-handicap probably shouldn’t compare his driver distance to a 25-year-old three-handicap and assume something is wrong.
Use the right benchmark.
Why your number may not match the chart
These numbers are averages, not targets. Swing speed, strike quality, launch and spin all play into this. Even the way you have your driver set up or the conditions where you play have an impact.
Elevation is a good example. In the Arccos data, a representative 10 handicap golfer averages 220.5 yards at sea level and 239.7 yards at elevations above 5,000 feet. That’s a difference of more than 19 yards.
The Arccos dataset is based on real golf and the numbers are not adjusted to remove things like elevation, weather or turf conditions. So use your spot in the chart as a benchmark, not a number you have to chase.
Do you know how far you hit your driver?
The chart can tell you how far golfers like you hit it. It can’t tell you how far you hit it.
And there’s a big difference between knowing your driver distance and remembering just that one tee shot you caught perfectly last weekend.
These Arccos numbers represent total distance, meaning carry plus rollout, from real driver shots on par-4s and par-5s. If you want to compare yourself fairly, you need the same kind of information from your own game.
A few things to keep in mind:
- Look at a collection of on-course drives, not your longest one.
- Compare total distance to total distance. Don’t compare your launch monitor carry number to this chart.
- Give yourself enough shots for the number to mean something. One unusually fast, firm or windy round can move the average.
- If you’re well below your age and handicap group, don’t immediately assume you need new equipment. Speed, strike, launch and fit are all worth looking at.
- If you’re well above the average, that’s useful information, too. Just make sure the extra distance is helping you play better golf.
This is also one of the reasons tracking your game is so valuable. Arccos can build your distances from what you do on the course instead of what you think you do. Arccos Air can automatically capture shots without club sensors and the latest app tools can then use that data to help identify areas of your game that need attention.
Methodology
Figures are from the Arccos Annual Driving Distance Report, 2026 Edition. The dataset includes a random sample of more than 37,000 golfers, each with at least 100 driver tee shots from verified rounds, representing almost 10 million on-course driver shots on par-4s and par-5s during the 2025 calendar year. Driver distance reflects total yardage including carry and rollout.
Get more from MyGolfSpy
Create a free account to build your golfer profile and get personalized recommendations from our testing (coming soon!)
[uwp_register]








Mike G
1 month ago
At 69, I absolutely have lost considerable distance over time. These days the only way I’m hitting 250 is with a fortuitous bounce off a cart path.