

How Do You Measure Up?
Apart from whatever fun the game of golf offers, are we all just wasting our time? Can the wisdom of age make us better golfers, or will father time catch up before we wise up? Is stagnation the only real certainty?
We crunched the data to find the answers to these and other age-related golf questions. What we discovered may surprise you.
The Data
As we did when we discussed Golfer Performance by Handicap, we leveraged data from TheGrint, a golf handicap and stat tracking service, to take a closer look at how age impacts performance. As you’ll see from the charts, the good news is that, while each of us will invariably reach a point of diminishing returns, our golf skills may not decline as early or as rapidly as you might think. The bad news is that regardless of how long we play, we might not actually get much better either.
Worth mentioning again, because of the online and app-based nature of TheGrint, it’s reasonable to assume that its userbase skews a bit younger and more tech-savvy than the golfing population as a whole.
Before we look at the really interesting stuff, let’s take a quick look at the breakdown of our demographics, sorted by age.

Insights:
The highest percentage of golfers who track their scoring statistics via TheGrint are in the 30-40 year-old age group.
A comparatively small number of young golfers (under 20) and older golfers (over 70) golfers leverage TheGrint’s golf stat tracking capabilities.
While the comparative lack of participation among presumably tech-savvy teenagers is surprise (perhaps there just aren’t that many of them playing golf), it’s not surprising to see usage of a golf stat tracking service decline as age increases.
Average Scoring By Age
This graph shows the performance of golfers by age. For this chart we use both the score itself and handicap differential. The score is a good metric, and one that all golfers understand, but it doesn’t take into consideration which tees were used by the golfer. Handicap differential does exactly that, which makes it an excellent baseline for normalizing performance.
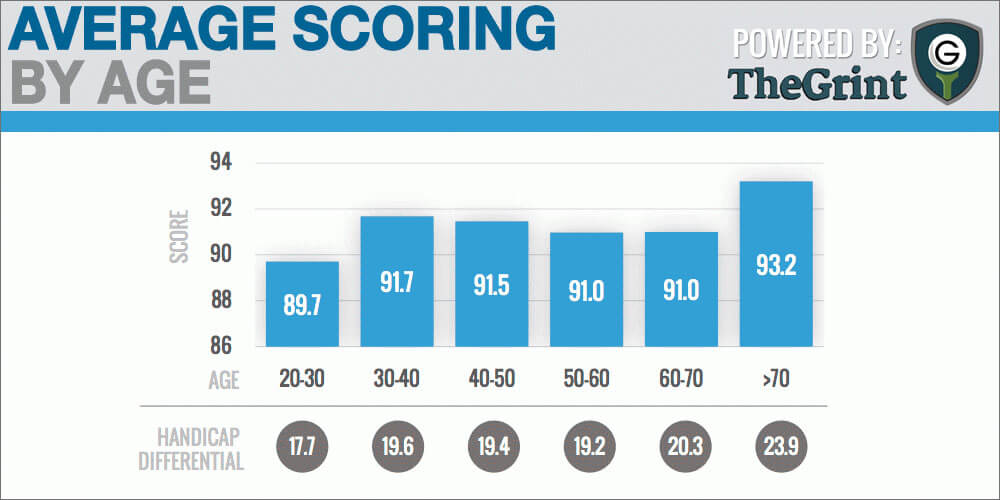
Insights:
It’s noteworthy that the outliers are at the extremes.
The 20-30 year old group shows the best performance by more than a stroke. While the reasons aren’t immediately clear, some will no doubt guess that the younger demographic has more time to devote to golf. The cynics will likely assume the young guys cheat at a greater frequency than older golfers. It’s also entirely plausible that those playing with regularity at this age group are simply more likely to be accomplished golfers than the population as a whole.
It’s equally as interesting that other than the most senior golfers, the highest scores are reported by the 30-40 year olds. To a large extent, this demographic represents golf’s lost generation; an age range that often finds us in the most intense part of our professional careers. Look at most any club’s membership roster and you’ll discover that this is a demographic that doesn’t currently spend much time on the golf course
Par 3, 4, and 5 Scoring By Age
This graph illustrates scoring by age relative to par for par 3, 4, and 5 holes.
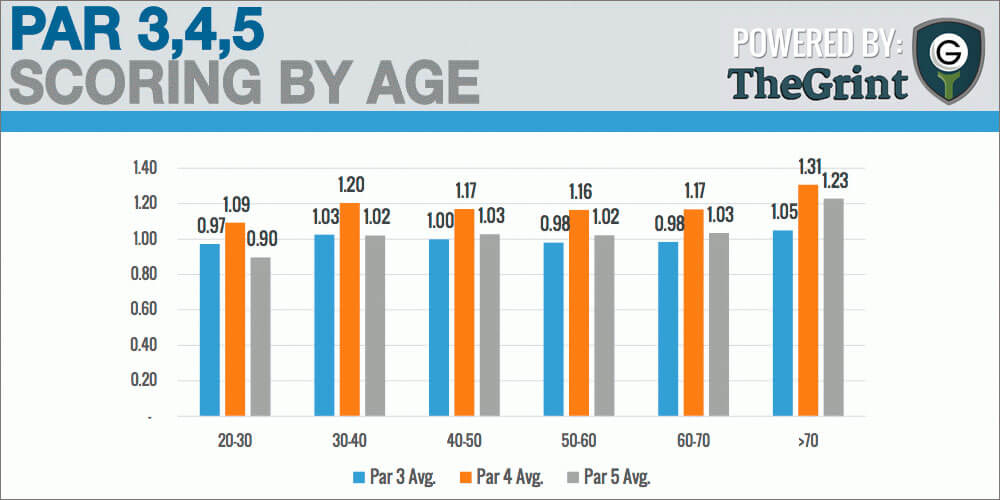
Insights:
What’s interesting about this chart is that it shows no significant difference in scores from age 30 to age 70. While some of us will likely see our skills diminish, others will certainly improve. While that appears to be a recipe for stagnation of the average, it also offers a glimmer of hope that we can always get better.
Also noteworthy is that between the ages of 30 and 70, golfers are shown to be statistical equals. After age 70, however; scoring declines in general with Par 4 and Par 5 scoring increasing significantly. The logical assumption is that once we reach a certain age, hitting greens in regulation on longer holes becomes more difficult, if not impossible.
Average Putts By Age
This graph shows putts per round and GIR% performance of golfers by age.

Insights:
First is important to understand the close relationship between Putts per Round and GIR% per round.
Missed greens lead to fewer putts.
Think about it. When you hit the Green in Regulation, your approach shot most likely comes from a longer distance than it does after you’ve missed the green. In most cases that GIR from distance will leave you farther from the hole than your wedge will after you’ve missed the green.
With that in mind, while this graph shows relatively consistent performance from age group to age group, what’s really interesting is that GIR% declines with age. Consequently, we would expect the older groups to have fewer putts per round.
The fact that the oldest golfers hit roughly the same number of putts as the younger groups runs counter to the idea that the short game is the biggest strength of the older generation. The data actually suggests that it’s strength in other areas of the game that allow seniors to keep pace with younger golfers.
Want to See More?
If you’ve enjoyed this series with TheGrint, and would like to see more, definitely let us know. We’re happy to do more digging. While you’re waiting, be sure to check out TheGrint, and start tracking your game today.


Earlyriser
4 years ago
Really like the website, interesting statistics on age but would like to add the difference I’ve found coming from the northeast to the southeast (SC) and playing on Bermuda grass and extremely rolling terrain. After playing some 40 years in the NE and retiring in the SE, I feel there is no way I could have kept my 8 handicap from the north down here.