


Are you an “average” driver of the golf ball?
It sounds like a simple question but in modern golf the answer is not always obvious. Golfers talk about distance constantly. New drivers promise more speed, more carry and a few extra yards off the tee. But distance alone does not explain how golfers perform with the driver.
To get a better picture of what driving performance looks like today, we examined the Shot Scope 2026 Annual Golf Performance Report. The report analyzes more than 74 million shots across 870,000 rounds played on more than 24,000 courses worldwide, offering one of the largest datasets available on amateur golf performance.
So, what does an average drive look like in 2026?
Driving distance still increases with skill
The Shot Scope data shows a clear relationship between handicap and driving distance. Lower handicap players tend to hit the ball farther but the differences between skill levels are smaller than many golfers expect.
Average driver distances in the report look like this:
| Handicap | Average Drive |
|---|---|
| Scratch | 261 yards |
| 5 handicap | 242 yards |
| 10 handicap | 228 yards |
| 15 handicap | 214 yards |
| 20 handicap | 202 yards |
| 25 handicap | 195 yards |
The bigger difference is consistency
The Shot Scope report also compares a golfer’s average drive with their performance average which measures the distance of well-struck drives with mishits removed.
The difference between these two numbers is larger than many golfers expect.
| Handicap | Average Drive | Performance Average |
|---|---|---|
| 10 handicap | 228 yards | 253 yards |
| 15 handicap | 214 yards | 240 yards |
A well-struck drive from a 15-handicap golfer (240 yards) travels farther than the average drive of a 10-handicap golfer (228 yards). This shows that many golfers already have the distance they need to get to a lower handicap; the difference is often how they produce it.
Most golfers miss in similar ways
Many golfers assume better players hit the driver dramatically straighter.
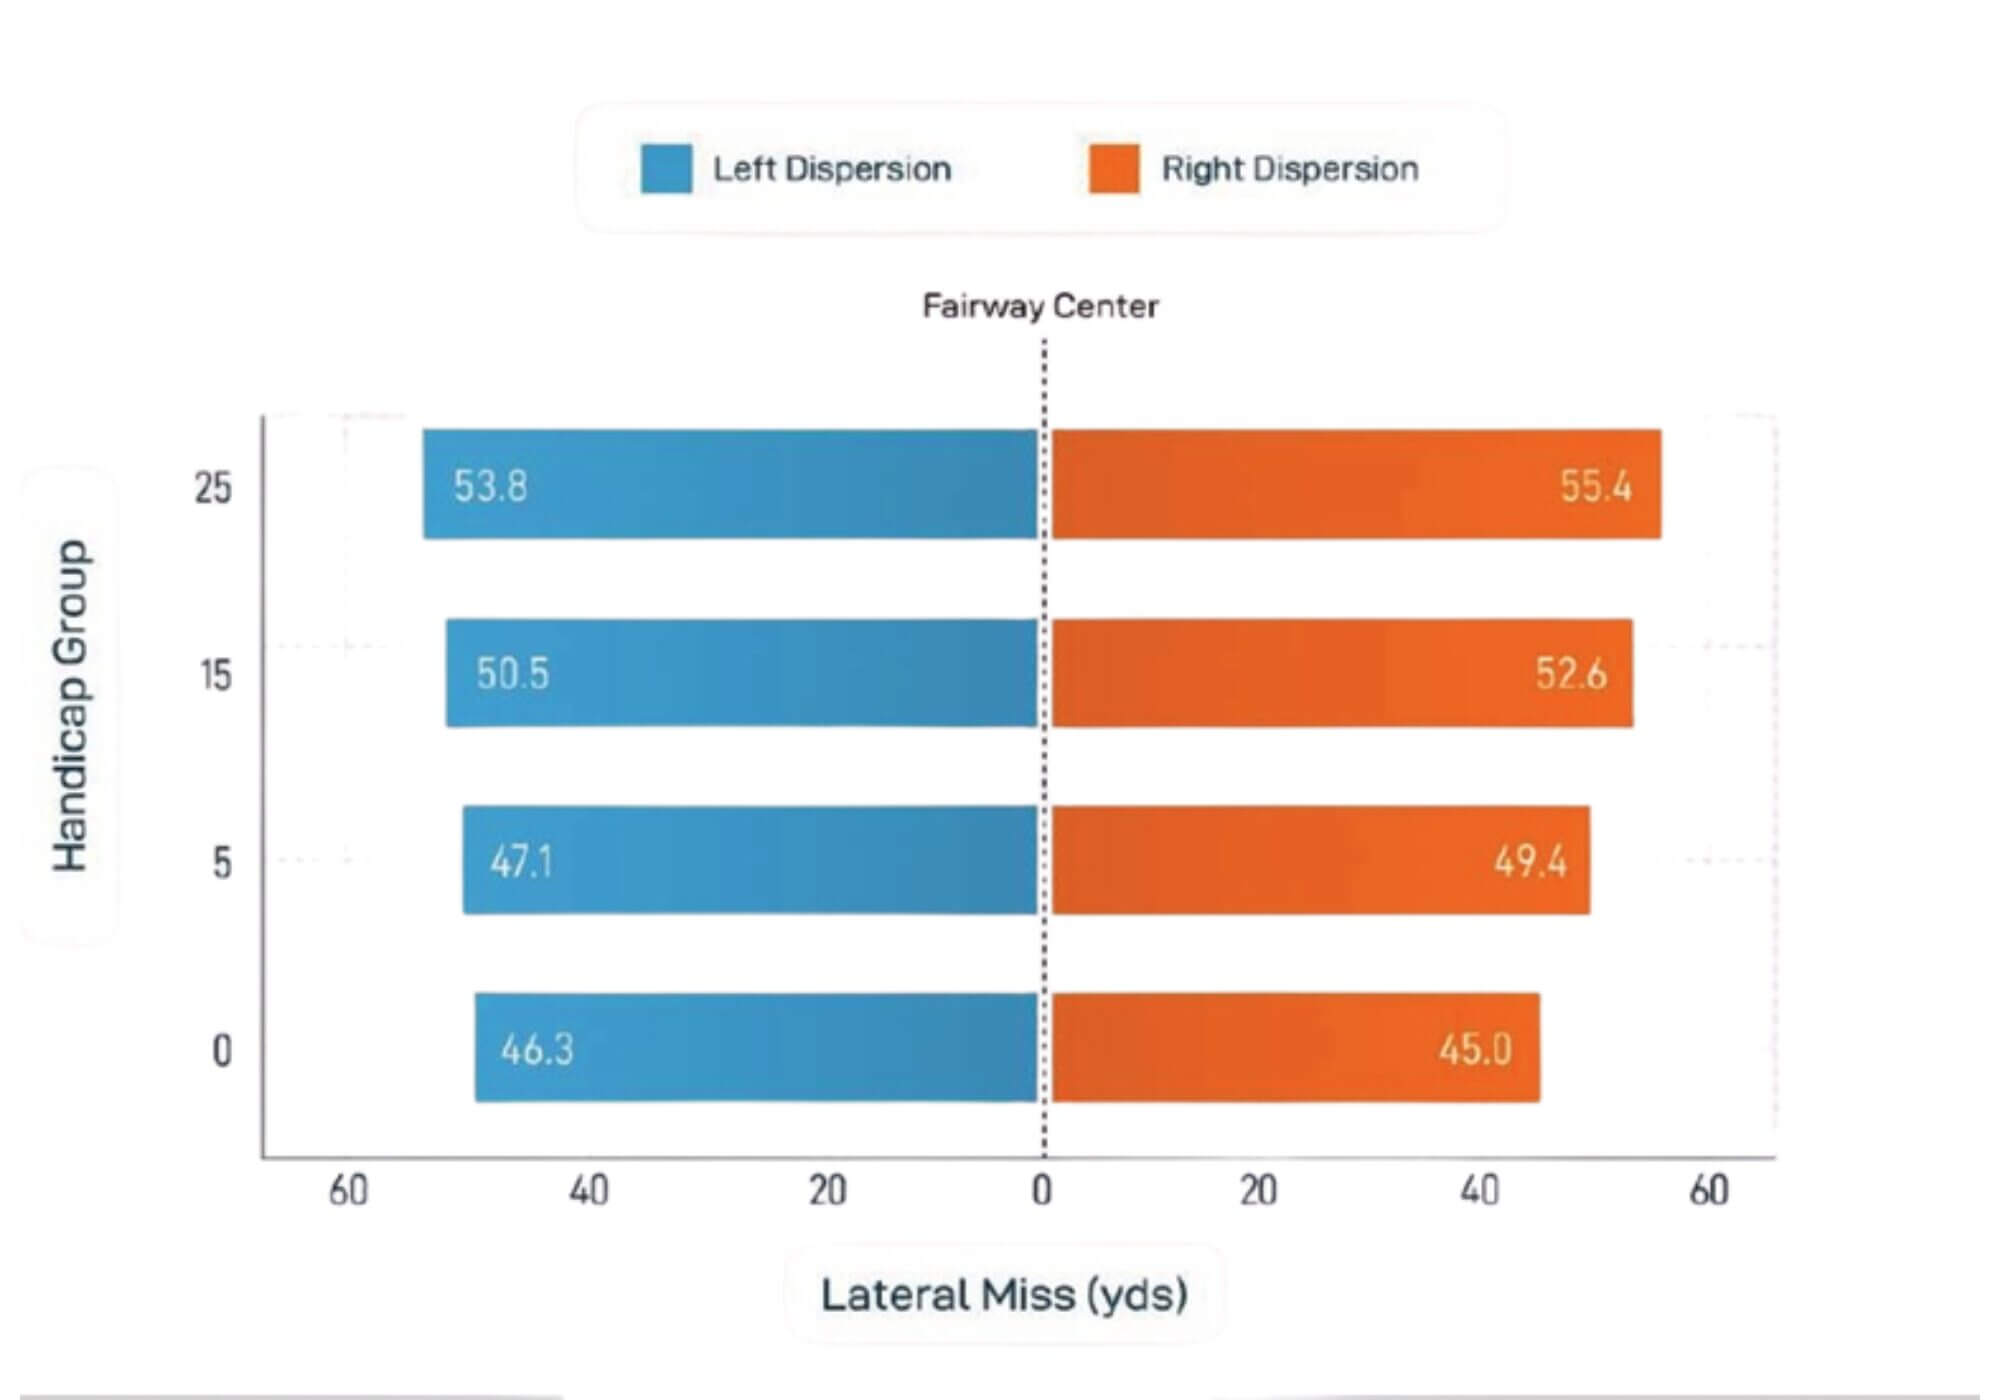
The Shot Scope data shows that tee shot dispersion patterns are surprisingly similar across handicap levels.
Most golfers show a slight tendency to miss to the right. The key difference is the size of the miss. Better players reduce the biggest misses that lead to penalty strokes or difficult recovery shots.
They still miss fairways but they avoid the mistakes that compound into bigger problems later in the hole.
Final thoughts: What an average drive really looks like
So what does an average drive look like in 2026?
Based on the Shot Scope data, if you’re an average driver of the golf ball in 2026, your stats probably look like this:
- Drive the ball around 200 to 220 yards
- Miss slightly right more often than left
- Have more distance in the tank but don’t access it consistently








Lefthack
7 months ago
Stories like this make me feel a little better. I am trying to get more club head speed for a little more distance, but it seems I’m actually pretty average. At 54 and a 12.5 handicap, I’m at about 225 average drive. The frustrating part is my 3 wood off the deck is sometimes further than my drive. 🤣
My goal is to average 250 and to get to single digit cap this year.